Electronics Store Footfall Analytics in India: Turning Browsers into Buyers
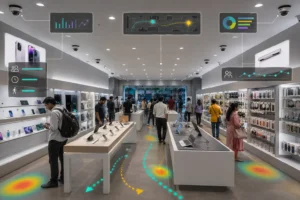
Electronics store footfall analytics in India is becoming the difference between a showroom that merely attracts crowds and one that converts them. Walk into any phone or electronics outlet in a busy Indian high street or mall and you will see the same pattern: plenty of people drifting past the entrance, clusters forming around the newest handset, and staff who are either swamped at peak hours or idle in the lulls. The footfall is there. The question every operator in this market is now asking is how much of that footfall actually turns into a sale, and where exactly buyers are slipping away. AI-powered video analytics answers that question by reading the cameras you already have on the wall.
For Indian electronics retail specifically, the stakes are sharp. Margins on devices are thin, competition from e-commerce is relentless, and the in-store experience is one of the few advantages a physical store still holds. Knowing precisely how shoppers move, where they linger, and which displays earn attention lets you defend that advantage with data rather than guesswork.
From Passer-by to Buyer: What the Cameras Measure
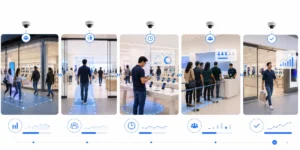
Passing Traffic
Footpath &
storefront counts
Entry & Capture
Door footfall,
capture rate
Demo-Zone Dwell
Time at displays,
heat zones
Conversion
Counter / billing
interaction
Each stage is counted on existing CCTV — no shopper is identified, only movement and dwell are measured.
KenVision · privacy-first, on-prem video intelligence
Why footfall analytics matters more for electronics retail
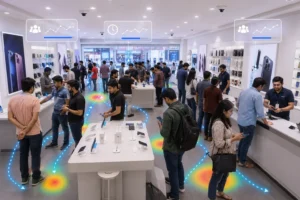
Electronics is a considered purchase. Unlike grocery, a shopper rarely walks in, picks up a phone, and pays in ninety seconds. They browse, compare, handle the device, ask questions, leave to check a price online, and sometimes return. That long, looping journey is exactly why raw footfall counts mislead Indian operators. A store can post strong door numbers and still bleed sales because buyers never reach the right demo unit, never get a staff member at the deciding moment, or hit a queue at billing and abandon the basket.
Footfall analytics reframes the store as a funnel. It separates the people merely passing your frontage from those who enter, then tracks how many of those entrants engage with high-intent zones, and finally how many reach the counter. When you can see each step, you stop optimising for crowds and start optimising for conversion — the metric that actually pays the rent.
What AI video analytics measures in a phone and electronics store
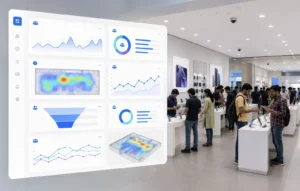
Modern video intelligence turns ordinary camera feeds into structured operational data. For an electronics outlet, the most useful measures are footfall and capture rate, demo-zone engagement, dwell time, and queue conditions at the billing counter.
Footfall and capture rate
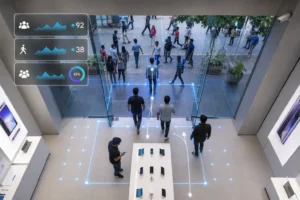
The system counts people crossing the storefront and people actually entering, giving you a capture rate — the share of passing traffic you convert into visitors. A low capture rate on a high-traffic street points to a window display, signage, or entrance-layout problem long before it shows up in sales reports.
Demo-zone engagement and dwell time
Phone and electronics stores live and die by their demo tables. Analytics measures how many visitors approach each display, how long they dwell, and which zones stay cold. A flagship handset table with high traffic but short dwell may signal a broken demo unit, a dead battery, or poor placement. A cold corner with premium stock tells you the layout is steering shoppers away from your highest-margin goods. This is the same demo-zone signal explored in our guide to demo-zone engagement at device displays, applied to the Indian store floor.
Queue detection at billing
In a market where buyers can complete the same purchase online in two taps, a long billing queue is a direct cause of walkouts. Video AI detects queue length and wait time in real time and can alert a manager to open a second counter before a browser-turned-buyer changes their mind.
Turning browsers into buyers: from data to action
Numbers only matter if they change what staff do. The point of electronics store footfall analytics in India is to convert measurement into a short list of daily decisions.
Staffing is the first lever. By overlaying footfall curves across the day and week, you can roster your strongest sales associates onto the genuine peaks — typically evenings and weekends in Indian urban retail — instead of spreading cover evenly. A shopper who gets attention at the moment of indecision is far likelier to buy than one left waiting beside a locked display.
Layout is the second. If demo-zone data shows shoppers consistently bypass a high-value accessories wall, you can relocate it into the natural traffic path revealed by the store heatmap. If a flagship table draws crowds but short dwell, you investigate the demo experience itself.
Conversion discipline is the third. By comparing entrants against counter interactions, a manager gets a store-level conversion rate they can act on weekly — and can test whether a new window display, a staffing change, or a queue intervention actually moved the number.
The KenVision difference: built for the store you already run
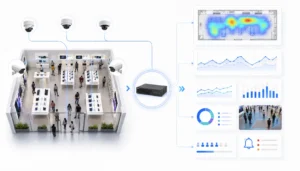
Most Indian electronics retailers do not want a rip-and-replace project. They want more value from infrastructure already on the wall. KenVision is camera-agnostic and works with your existing CCTV, so footfall, dwell, and queue analytics run on the cameras you installed years ago rather than a costly new sensor estate. Deployment is fast, and because the platform is built privacy-first with on-premise and edge processing options, video can be analysed locally rather than streamed to an external cloud.
That privacy-first design matters in the Indian regulatory climate. The Digital Personal Data Protection Act sharpens expectations around how personal data is handled, and an architecture that measures movement and dwell without identifying individuals — and that can keep processing on-site — gives operators a defensible footing. The analytics answer “how many, how long, where” without building shopper profiles.
To understand where this fits in the wider picture of camera-based intelligence, see our pillar overview, What Is AI Video Analytics?, and explore the full retail analytics solution for phone, electronics, and multi-format stores.
Getting started without overhauling the store
A practical rollout starts small: pick one or two outlets, point the analytics at existing entrance and demo-zone cameras, and establish a baseline for capture rate, dwell, and conversion. Once managers trust the numbers and act on the daily alerts, the same approach scales across a chain, letting head office benchmark locations against each other and spread what works. Because nothing is ripped out, the path from pilot to rollout is measured in weeks, not quarters.
Conclusion
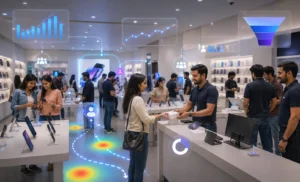
For Indian phone and electronics retailers, the in-store experience is the moat against online competition — but only if you can see it clearly. Electronics store footfall analytics in India turns existing cameras into a conversion engine: it shows where browsers gather, where they slip away, and where a small staffing or layout change recovers a sale. Capability, not crowds, is what compounds.
See it on your own store floor. Book a 30-minute KenVision demo and we’ll show how your current CCTV becomes a footfall-to-buyer analytics system.
Frequently asked questions
Do I need new cameras for footfall analytics in my electronics store?
No. KenVision is camera-agnostic and runs on your existing CCTV. In most stores, the entrance and demo-zone cameras already in place are enough to begin measuring capture rate, dwell time, and queue conditions.
Is footfall analytics compliant with Indian privacy expectations?
The platform is privacy-first and supports on-premise and edge processing, so video can be analysed locally. It measures movement, dwell, and counts rather than identifying individuals, which aligns with the direction of India’s Digital Personal Data Protection Act. You should still confirm your own signage and policy obligations.
What is “capture rate” and why does it matter?
Capture rate is the share of people passing your storefront who actually enter. A high-traffic location with a low capture rate usually points to a window, signage, or entrance problem — a fixable issue that conventional sales reports never surface.
How quickly can a store see results?
Because there is no hardware replacement, a single-store pilot can be running on existing cameras within weeks. Most operators start acting on staffing and layout insights as soon as the first reliable baselines are established.
Can this work across multiple electronics outlets?
Yes. Once a pilot proves out, the same analytics scale across locations so head office can benchmark stores against one another and standardise the layout and staffing tactics that convert best.
Leave a Reply