Blog

  • Crowd Density Monitoring & Public Safety with Video AI
    Crowd Density Monitoring & Public Safety with Video AI

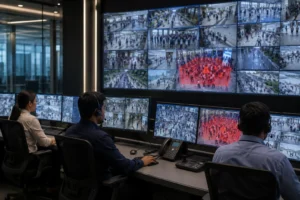
    Crowd density monitoring has become one of the most important applications of AI-powered video analytics for public safety. Whether it’s a packed railway station during rush hour, a stadium before kickoff, a religious gathering, or a city festival, crowd-related incidents rarely occur without warning. In most cases, dangerous situations develop gradually as more people enter a confined space, movement slows, and pressure builds around entrances, exits, or bottlenecks.

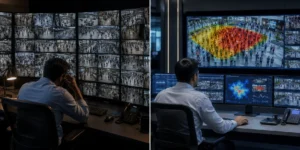
    Traditional CCTV systems capture these events, but they rely on operators continuously watching dozens or even hundreds of camera feeds. Spotting a dangerous build-up before it becomes critical is extremely difficult, especially in large public environments.

    AI-powered crowd density monitoring transforms existing CCTV cameras into proactive safety systems. Instead of simply recording video, computer vision continuously measures crowd density, analyses movement patterns, detects bottlenecks, and alerts operators before conditions become dangerous. This gives security teams valuable time to redirect pedestrian flow, deploy additional staff, or temporarily restrict access to prevent overcrowding.

    Unlike manual monitoring, AI works continuously, objectively, and in real time, making it one of the highest-value public safety applications of video analytics.


    Crowd Density Monitoring Workflow
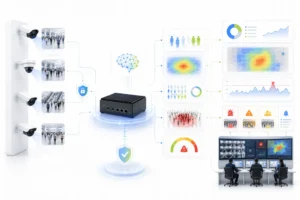
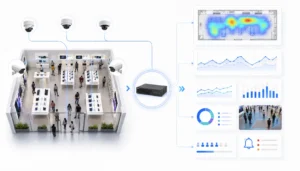
    Existing CCTV Cameras → AI Video Analytics → Density Calculation → Risk Assessment → Real-Time Alerts → Dashboard


    What Is Crowd Density Monitoring?

    Crowd density monitoring uses AI video analytics to measure how many people occupy a defined area at any given moment. Unlike simple people counting, which records the total number of entries and exits, density monitoring evaluates the concentration of people within specific zones.

    The system continuously calculates people per square metre across entrances, walkways, platforms, waiting areas, queues, concourses, and open public spaces. As density increases, predefined thresholds classify each area as normal, elevated, or critical.

    This provides operators with a live understanding of crowd conditions instead of relying solely on visual observation.

    Modern AI systems can monitor dozens or hundreds of cameras simultaneously, providing a complete operational view across large facilities while reducing the workload on security personnel.


    Why Density Matters More Than Crowd Size
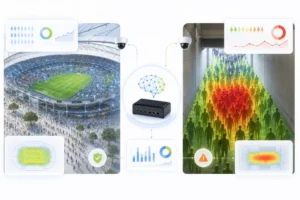
    One of the biggest misconceptions in crowd safety is that the total number of people determines risk.

    In reality, density is a far better indicator.

    A stadium with 50,000 spectators may operate safely because visitors are evenly distributed throughout the venue. Conversely, only a few hundred people gathered within a narrow corridor or entrance can create dangerous pressure points that increase the risk of falls, crushing, or blocked evacuation routes.

    As density increases:

    • Individual movement becomes restricted.
    • Crowd speed decreases.
    • Pressure builds around bottlenecks.
    • Emergency access becomes difficult.
    • Evacuation routes become obstructed.

    Because these conditions develop gradually, AI can detect them well before they become visible to human operators, creating an opportunity for early intervention rather than emergency response.


    How AI Crowd Density Monitoring Works


    Existing CCTV cameras stream video to an on-premises or edge AI processing platform.

    The AI system:

    • Detects people within each camera view.
    • Maps individuals into predefined monitoring zones.
    • Calculates density for each zone.
    • Tracks crowd movement and pedestrian flow.
    • Identifies congestion and bottlenecks.
    • Compares density against configurable safety thresholds.
    • Sends instant alerts when conditions become unsafe.
    • Displays live analytics through a central dashboard.

    Because processing occurs on-premises or at the edge, alerts are generated with extremely low latency while reducing unnecessary transmission of raw video.

    The result is a proactive early-warning system built on your existing surveillance infrastructure.


    Features of AI Crowd Density Monitoring

    Real-Time Density Measurement

    Continuously measures crowd density across every monitored zone, providing operators with an accurate live picture of occupancy levels.

    Risk Threshold Monitoring

    Automatically classifies areas as safe, elevated, or critical based on configurable density thresholds and operational policies.

    Instant Alerts

    Security teams receive immediate notifications whenever crowd density approaches unsafe levels, enabling faster intervention.

    Crowd Flow Analysis

    Visualises how people move through entrances, exits, corridors, concourses, and public spaces to identify congestion before it becomes a problem.

    Bottleneck Detection

    Automatically identifies choke points where pedestrian movement slows or stops, allowing operators to redirect visitors or open additional access routes.

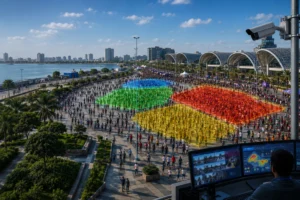
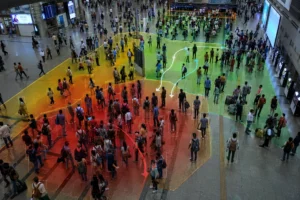
    Heat Maps

    Historical heat maps reveal which areas experience the highest concentration of visitors throughout the day, helping organisations optimise layouts and staffing.

    Centralised Dashboards

    Monitor multiple locations from a single interface with live density metrics, alerts, camera feeds, and historical reporting.


    Where Crowd Density Monitoring Is Used
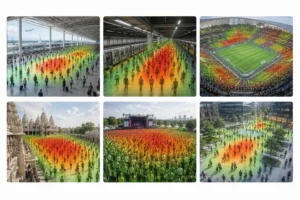
    Transit Hubs

    Railway stations, metro systems, airports, and bus terminals experience rapid fluctuations in passenger volume. AI continuously monitors platforms, ticketing areas, escalators, and waiting zones to improve passenger safety.

    Stadiums and Sports Venues

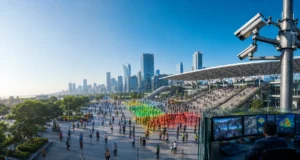
    Monitor seating sections, entrances, exits, concession areas, and evacuation routes to prevent overcrowding before and during major events.

    Religious Places

    Temples, mosques, churches, and pilgrimage sites often experience seasonal surges in visitor numbers. Real-time density monitoring helps organisers maintain safe movement throughout the venue.

    Festivals and Public Events

    Concerts, cultural festivals, exhibitions, and public celebrations benefit from live crowd monitoring that supports faster operational decisions.

    Smart Cities

    Municipal authorities use AI video analytics to understand pedestrian movement, monitor busy intersections, improve urban planning, and enhance public safety.

    Shopping Centres

    Large retail destinations monitor visitor density, queue formation, food courts, and common areas to improve both safety and customer experience.


    Privacy-First Crowd Monitoring

    One of the key advantages of AI crowd density monitoring is that safety does not require personal identification.

    KenVision measures anonymous crowd behaviour rather than individual identities. The platform focuses on counts, occupancy, movement, and density instead of facial recognition or biometric identification.

    Processing occurs on-premises or at the edge, allowing video to remain within the organisation’s infrastructure while only anonymised analytics, alerts, and operational insights are generated.

    This privacy-first architecture supports data minimisation, reduces compliance risk, and aligns with modern privacy expectations across both public and private sectors.


    Why Existing CCTV Cameras Are Enough
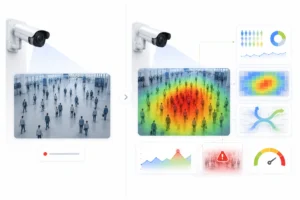
    Organisations often assume that implementing AI requires replacing their surveillance infrastructure.

    In reality, KenVision is camera-agnostic and integrates with most existing CCTV systems.

    This allows organisations to:

    • Avoid expensive camera replacement.
    • Deploy AI significantly faster.
    • Reduce implementation costs.
    • Preserve existing security investments.
    • Scale analytics across multiple sites.
    • Modernise surveillance without operational disruption.

    Instead of installing new hardware across an entire facility, existing cameras become intelligent sensors capable of delivering valuable operational insights.


    Benefits of AI Crowd Density Monitoring

    Deploying AI crowd monitoring provides benefits that extend far beyond emergency response.

    Improved Public Safety

    Early detection allows operators to intervene before dangerous crowd conditions develop.

    Faster Incident Response

    Real-time alerts enable security personnel to respond within seconds rather than relying on manual observation.

    Better Resource Allocation

    Historical analytics help organisations schedule staff, security personnel, and emergency responders more effectively.

    Improved Visitor Experience

    Reducing congestion creates smoother pedestrian movement and shorter waiting times.

    Operational Insights

    Long-term density trends help improve venue layouts, event planning, and infrastructure investments.

    Lower Costs

    Using existing CCTV infrastructure significantly reduces capital expenditure while improving operational efficiency.


    Traditional CCTV vs AI Crowd Density Monitoring

    Traditional CCTV AI Crowd Density Monitoring
    Passive recording Real-time analytics
    Manual monitoring Automated detection
    Reactive response Predictive alerts
    No density measurement Live density calculation
    Difficult to monitor many cameras Centralised multi-site monitoring
    Human judgement Objective AI measurements

    The Bottom Line

    Crowd incidents are rarely instantaneous. They develop over time as pedestrian density increases, movement slows, and pressure builds around key access points. The organisations that prevent these incidents are those that recognise warning signs early enough to take action.

    AI-powered crowd density monitoring transforms existing CCTV cameras into intelligent early-warning systems that continuously measure crowd conditions, identify congestion, detect bottlenecks, and generate real-time alerts before safety risks escalate.

    With privacy-first, on-premises deployment and compatibility with existing surveillance infrastructure, KenVision enables organisations to improve public safety without replacing cameras or compromising privacy.

    If you’re looking to modernise crowd safety across transport hubs, stadiums, public spaces, or smart city environments, book a 30-minute KenVision demo to see how AI-powered crowd density monitoring can help protect people while improving operational visibility.


    Frequently Asked Questions

    What is crowd density monitoring?

    Crowd density monitoring uses AI video analytics to measure the number of people occupying a specific area in real time. It identifies overcrowding before conditions become unsafe and provides early alerts to operators.

    How does AI crowd density monitoring work?

    The system analyses live CCTV video using computer vision, detects people, calculates density within predefined zones, monitors crowd movement, and generates alerts when configurable safety thresholds are exceeded.

    What is the difference between crowd density and occupancy?

    Occupancy measures the total number of people in a location, while crowd density measures how closely people are packed within a specific area. Density is generally a more accurate indicator of crowd safety.

    Does crowd density monitoring identify people?

    No. KenVision focuses on anonymous counting, movement analysis, and density measurement rather than identifying individuals. Processing can be performed on-premises or at the edge to further protect privacy.

    Can it work with existing CCTV cameras?

    Yes. KenVision is camera-agnostic and integrates with most existing CCTV infrastructure without requiring camera replacement.

    Where is AI crowd monitoring commonly used?

    It is widely used in airports, railway stations, metro systems, stadiums, shopping centres, religious places, festivals, smart cities, transport interchanges, and other high-occupancy public spaces.

    Can crowd monitoring predict dangerous situations?

    AI cannot predict every incident, but it continuously monitors crowd density and movement patterns to identify conditions that commonly precede overcrowding and crowd safety risks, enabling earlier intervention.

    What are the benefits of edge AI for crowd monitoring?

    Edge AI processes video close to the camera, reducing latency, minimising bandwidth usage, improving privacy, and enabling faster safety alerts compared to cloud-only processing.
  • Video Analytics Privacy Compliance: India’s DPDP Act vs Canada’s PIPEDA

    Video Analytics Privacy Compliance: India’s DPDP Act vs Canada’s PIPEDA

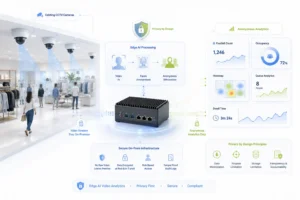
    Video analytics privacy compliance is now a board-level question, not a back-office one. The moment a camera feed is processed by AI to count people, estimate demographics, or flag suspicious behaviour, you have moved from passive recording into the active processing of personal data. For organisations that operate across India and Canada, that single capability has to satisfy two very different legal regimes at once: India’s Digital Personal Data Protection (DPDP) Act, 2023 and Canada’s Personal Information Protection and Electronic Documents Act (PIPEDA). This guide breaks down where the two diverge, where they quietly agree, and the architecture that lets one deployment stay compliant in both markets.

    Existing
    CCTV camera

    On-prem / edge
    AI processing

    Anonymised
    counts & events

    Dashboards
    & alerts

    DPDP: consent + residency

    PIPEDA: reasonable purpose Privacy-first video analytics: where personal data is minimised before it ever leaves the site

    Why video analytics is a privacy question at all

    Traditional CCTV records and stores footage. AI video analytics goes further: it interprets the footage to produce structured data such as footfall counts, dwell times, queue lengths, or behaviour alerts. Where that interpretation involves identifiable individuals (a recognisable face, a tracked person, an estimated age or gender), regulators treat it as the processing of personal data. The privacy risk is not the camera; it is what the analytics layer extracts, where that extraction happens, and how long anything identifiable is retained. If you want a primer on the underlying technology first, start with our pillar guide on what AI video analytics is.

    India’s DPDP Act: consent, notice, and data residency

    The DPDP Act, 2023 governs the processing of digital personal data in India. Its centre of gravity is consent. Before processing personal data, a Data Fiduciary generally must give a clear notice of purpose and obtain the individual’s consent, with limited “legitimate uses” as alternatives. For video analytics this raises practical questions: how do you obtain consent from everyone walking past a camera, and what counts as adequate notice in a public retail space? In practice, the safest posture is to avoid processing identifiable personal data wherever the business goal does not require it. If you only need a footfall count, you do not need an identity.

    The Act also introduces obligations around purpose limitation, data minimisation, retention only for as long as necessary, breach notification, and the rights of individuals to access and erase their data. The Government may further restrict cross-border transfers to specified countries, so data residency and the ability to keep processing inside India become design constraints rather than afterthoughts. Children’s data and Significant Data Fiduciaries carry heightened duties, which matters for any deployment near schools, families, or large-scale monitoring.

    Canada’s PIPEDA: reasonable purpose and meaningful consent

    PIPEDA applies to private-sector organisations that collect, use, or disclose personal information in the course of commercial activity. Its anchoring test is different in flavour: an organisation may only collect personal information for purposes that a reasonable person would consider appropriate in the circumstances, and consent must be meaningful. Canadian privacy regulators have repeatedly signalled that covert or overly broad video surveillance, and especially facial recognition, attracts close scrutiny and a high bar for justification.

    PIPEDA’s ten fair information principles map closely onto operational controls: accountability, identifying purposes, consent, limiting collection, limiting use and retention, accuracy, safeguards, openness, individual access, and the ability to challenge compliance. Signage that clearly identifies the purpose of monitoring, a named accountable individual, and a documented retention schedule go a long way. Note that Canada’s framework continues to evolve, and several provinces operate their own substantially similar private-sector laws, so a multi-site Canadian rollout should confirm which statute applies where.

    Where the two regimes agree

    Despite different vocabularies, DPDP and PIPEDA converge on the same engineering instincts. Both reward minimisation: collect the least identifiable data needed for the stated purpose. Both expect a clearly stated, limited purpose rather than open-ended surveillance. Both require retention limits and the ability to honour access and deletion. And both treat biometric identification as a higher-risk activity that demands stronger justification and, often, explicit consent. An architecture built for the stricter of the two on each dimension will generally satisfy the other.

    The architecture that satisfies both: privacy-first by design

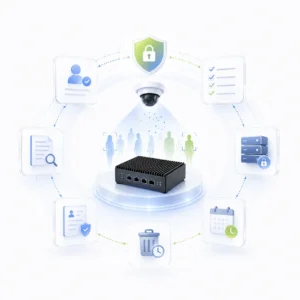
    This is where deployment choices do most of the compliance work. A privacy-first video analytics stack processes frames on-premises or at the edge, converts them immediately into anonymised, non-identifying outputs such as aggregate counts and zone-level events, and discards or never persists raw identifiable data. Because the heavy processing stays inside the building, raw video does not need to traverse the public internet or land in a foreign cloud, which directly addresses DPDP data-residency concerns and PIPEDA safeguarding expectations at the same time.

    KenVision is built around exactly these constraints. It works with your existing CCTV cameras, so there is no rip-and-replace and no new identifiable data source. It is camera-agnostic and deploys quickly, and it supports on-prem and edge processing so personal data can be minimised before anything leaves the site. For high-value retail use cases, behaviour alerts can be tuned to events rather than identities. You can see the broader capability set on our video surveillance solutions page, and the deeper architectural rationale in our companion article on privacy-first video AI and data sovereignty.

    A practical video analytics privacy compliance checklist

    Before a camera goes live, work through a short, defensible list: define the single business purpose and the minimum data needed to serve it; decide whether you can meet that purpose with anonymised aggregates instead of identities (you usually can); keep AI processing on-prem or at the edge so identifiable data stays on site; set and enforce a retention schedule with automatic deletion; post clear notice or signage describing the purpose; name an accountable owner and document a data-handling policy; build a route for individuals to make access and deletion requests; and run a privacy impact assessment for anything involving biometrics, children, or large-scale monitoring. Crucially, treat each region’s strictest requirement as your baseline so one configuration travels across India and Canada without re-engineering.

    Book a privacy-first deployment review

    If you operate across multiple jurisdictions and want video analytics that respects both DPDP and PIPEDA without a forklift upgrade, we can walk you through a privacy-first deployment on your existing cameras. Book a 30-minute demo and we will map your use case to the right minimisation and residency controls.

    Frequently asked questions

    Does AI video analytics always count as processing personal data?

    Not always. If the system only produces anonymised aggregates such as footfall counts or queue lengths and never persists identifiable images, the privacy footprint is far smaller. Identification, face matching, or tracking individuals is what typically brings data into scope under DPDP and PIPEDA.

    What is the biggest difference between DPDP and PIPEDA for video analytics?

    DPDP is consent-and-residency centric and may restrict cross-border data transfers, while PIPEDA centres on whether a reasonable person would consider the purpose appropriate and on meaningful consent. Both, however, reward data minimisation and on-site processing.
    Can on-premises processing remove most compliance risk?

    It removes a large share of it. Keeping raw video and AI inference inside the building reduces cross-border transfer exposure, limits the data that could be breached, and supports retention and deletion controls. It does not replace the need for notice, a defined purpose, and an accountable owner.

    Do we need consent for footfall counting in a store?

    Where counting is fully anonymised and no individual is identified or tracked, the obligations are lighter, though clear signage and a documented purpose remain best practice. Demographic estimation or behaviour tracking raises the bar and should be assessed case by case.

    Does KenVision require us to replace our cameras?

    No. KenVision is camera-agnostic and works with existing CCTV, adding the analytics layer without a rip-and-replace, which also avoids introducing a new identifiable data source.

  • Fire & Smoke Detection from Cameras vs. Traditional Sensors

    Fire & Smoke Detection from Cameras vs Traditional Sensors

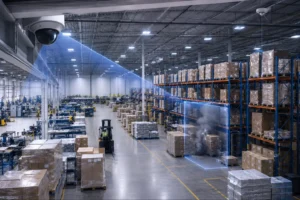
    Traditional smoke and heat detectors have protected buildings for decades, but they only react when smoke or heat reaches the sensor. AI fire and smoke detection from cameras takes a different approach. Instead of waiting for a fire to reach a single point, it continuously watches the entire space and detects the visual signs of smoke or flames wherever they appear within the camera’s field of view.

    For warehouses, factories, shopping centres, construction sites, logistics hubs, airports and other large facilities, those extra moments can make a significant difference. Camera based fire detection provides earlier visual awareness, precise location information and instant video verification, helping teams respond faster while working alongside existing fire safety systems.


    Understanding the Difference Between Cameras and Traditional Fire Sensors

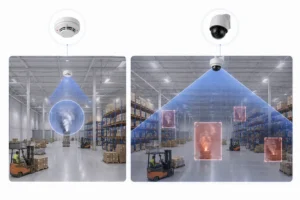
    Traditional smoke and heat detectors monitor only the small area around each device. Smoke or rising heat must physically travel to the detector before an alarm can be triggered. In enclosed offices this approach is highly effective, but in large open environments smoke may take longer to reach the sensor, particularly where ceilings are high or ventilation changes the direction of airflow.

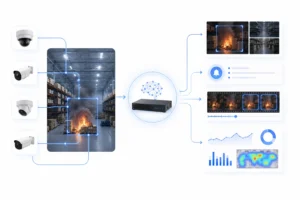
    AI powered video analytics works differently. Existing CCTV cameras continuously monitor the entire scene, allowing computer vision models to identify visible smoke, flames and other early indicators of fire across the full camera view.

    This means the system is not waiting for smoke to reach a detector. It is watching for the first visible signs of a developing incident.


    Why Camera Based Fire Detection Responds Earlier

    The biggest advantage of camera based fire detection is visibility.

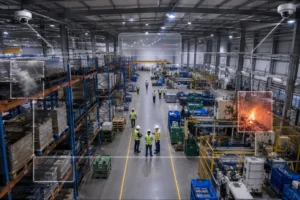
    Instead of monitoring one location, a single camera can observe entrances, production areas, storage racks, loading bays or warehouse aisles at the same time. As soon as smoke or flames become visible, the AI can generate an alert together with the exact camera location and supporting video clip.

    This gives security teams, facility managers and emergency responders immediate context so they know exactly where to investigate.


    Fire Detection in Large Industrial Spaces

    Large facilities present unique challenges for traditional detection systems.

    Warehouses often have high ceilings where smoke takes time to accumulate. Manufacturing plants contain machinery, conveyors and production lines spread across large areas. Construction sites frequently include temporary structures where installing additional detectors may not always be practical.

    Camera based fire detection provides continuous visual coverage across these environments by analysing existing CCTV footage in real time.

    Common applications include:

    • Warehouses
    • Manufacturing facilities
    • Logistics centres
    • Construction sites
    • Airports
    • Shopping malls
    • Data centres
    • Outdoor storage yards

    AI Detects More Than Smoke

    Modern AI video analytics can recognise multiple visual indicators associated with fire.

    These include:

    • Visible smoke
    • Open flames
    • Rapid changes in light intensity caused by flames
    • Heat shimmer in certain environments
    • Escalating fire behaviour over time

    By analysing these patterns together, AI provides faster and more intelligent detection than simple motion based systems.


    Existing CCTV Makes Deployment Simple

    One of the biggest advantages of AI fire detection is that it uses the CCTV infrastructure many organisations already own.

    KenVision is camera agnostic, allowing existing security cameras to become intelligent fire monitoring devices without replacing the current surveillance system.

    Because processing can take place on premises or at the edge, alerts are generated locally with minimal delay while keeping video within the organisation’s infrastructure.


    Camera Detection Complements Traditional Fire Systems

    AI camera detection is not intended to replace certified fire alarm systems.

    Instead, it strengthens them.

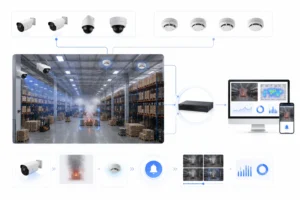
    Traditional smoke detectors remain essential for regulatory compliance and life safety. Camera based detection adds an additional layer of early visual awareness by identifying smoke and flames before they reach a detector in many large or open environments.

    Together they provide faster awareness, wider coverage and visual confirmation that helps emergency teams respond with greater confidence.


    Why Organisations Are Adopting AI Fire Detection

    Businesses are increasingly looking for ways to improve fire safety without replacing existing infrastructure.

    By combining CCTV with AI video analytics, organisations can:

    • Detect smoke earlier across large areas
    • Identify the exact location of an incident
    • Receive real time alerts
    • Verify incidents using live video
    • Improve response times
    • Reduce unnecessary manual monitoring
    • Add intelligence to existing CCTV systems

    Conclusion

    Every second matters when a fire begins.

    Traditional smoke detectors remain a critical part of every fire protection strategy, but they can only react after smoke or heat reaches the device. AI fire and smoke detection from cameras provides an earlier layer of visual awareness by continuously monitoring the entire scene and identifying developing incidents wherever they appear.

    For facilities with existing CCTV, this means faster detection, better situational awareness and more informed emergency response without replacing current infrastructure.

    Book a 30 minute KenVision demo to see how your existing cameras can become an intelligent fire and smoke detection system.


    Frequently Asked Questions

    Can AI cameras detect smoke before traditional smoke detectors?

    In many large or open environments they can. AI analyses the visible appearance of smoke and flames across the entire camera view instead of waiting for smoke to reach a detector.

    Does camera based fire detection replace smoke detectors?

    No. It complements traditional fire detection systems by providing earlier visual awareness and precise location information.

    Can the system use existing CCTV cameras?

    Yes. KenVision is camera agnostic and works with existing CCTV infrastructure, helping organisations add AI powered fire detection without replacing their cameras.

    Where is camera based fire detection most useful?

    It is particularly valuable in warehouses, factories, logistics centres, shopping malls, airports, construction sites and other large spaces where wide visual coverage is important.

    Can AI fire detection work outdoors?

    Yes, depending on the camera placement and environmental conditions. It can monitor outdoor storage areas, loading bays and other open spaces where conventional point detectors may not provide sufficient coverage.

  • Electronics Store Footfall Analytics in India: Turning Browsers into Buyers

    Electronics Store Footfall Analytics in India: Turning Browsers into Buyers

    Electronics store footfall analytics in India is becoming the difference between a showroom that merely attracts crowds and one that converts them. Walk into any phone or electronics outlet in a busy Indian high street or mall and you will see the same pattern: plenty of people drifting past the entrance, clusters forming around the newest handset, and staff who are either swamped at peak hours or idle in the lulls. The footfall is there. The question every operator in this market is now asking is how much of that footfall actually turns into a sale, and where exactly buyers are slipping away. AI-powered video analytics answers that question by reading the cameras you already have on the wall.

    For Indian electronics retail specifically, the stakes are sharp. Margins on devices are thin, competition from e-commerce is relentless, and the in-store experience is one of the few advantages a physical store still holds. Knowing precisely how shoppers move, where they linger, and which displays earn attention lets you defend that advantage with data rather than guesswork.

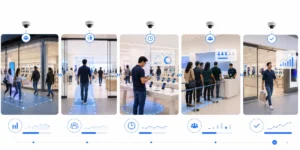
    From Passer-by to Buyer: What the Cameras Measure

    Passing Traffic
    Footpath &
    storefront counts
    Entry & Capture
    Door footfall,
    capture rate
    Demo-Zone Dwell
    Time at displays,
    heat zones
    Conversion
    Counter / billing
    interaction
    Each stage is counted on existing CCTV — no shopper is identified, only movement and dwell are measured.
    KenVision · privacy-first, on-prem video intelligence

    Why footfall analytics matters more for electronics retail

    Electronics is a considered purchase. Unlike grocery, a shopper rarely walks in, picks up a phone, and pays in ninety seconds. They browse, compare, handle the device, ask questions, leave to check a price online, and sometimes return. That long, looping journey is exactly why raw footfall counts mislead Indian operators. A store can post strong door numbers and still bleed sales because buyers never reach the right demo unit, never get a staff member at the deciding moment, or hit a queue at billing and abandon the basket.

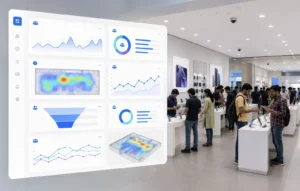
    Footfall analytics reframes the store as a funnel. It separates the people merely passing your frontage from those who enter, then tracks how many of those entrants engage with high-intent zones, and finally how many reach the counter. When you can see each step, you stop optimising for crowds and start optimising for conversion — the metric that actually pays the rent.

    What AI video analytics measures in a phone and electronics store

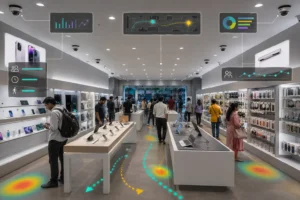
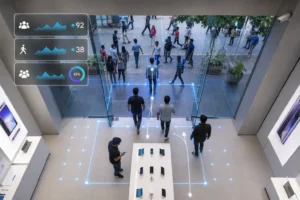
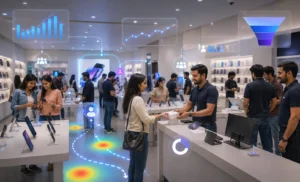
    Modern video intelligence turns ordinary camera feeds into structured operational data. For an electronics outlet, the most useful measures are footfall and capture rate, demo-zone engagement, dwell time, and queue conditions at the billing counter.

    Footfall and capture rate

    The system counts people crossing the storefront and people actually entering, giving you a capture rate — the share of passing traffic you convert into visitors. A low capture rate on a high-traffic street points to a window display, signage, or entrance-layout problem long before it shows up in sales reports.

    Demo-zone engagement and dwell time

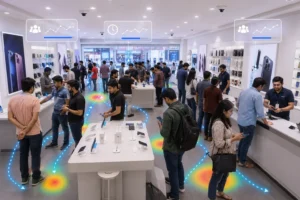
    Phone and electronics stores live and die by their demo tables. Analytics measures how many visitors approach each display, how long they dwell, and which zones stay cold. A flagship handset table with high traffic but short dwell may signal a broken demo unit, a dead battery, or poor placement. A cold corner with premium stock tells you the layout is steering shoppers away from your highest-margin goods. This is the same demo-zone signal explored in our guide to demo-zone engagement at device displays, applied to the Indian store floor.

    Queue detection at billing

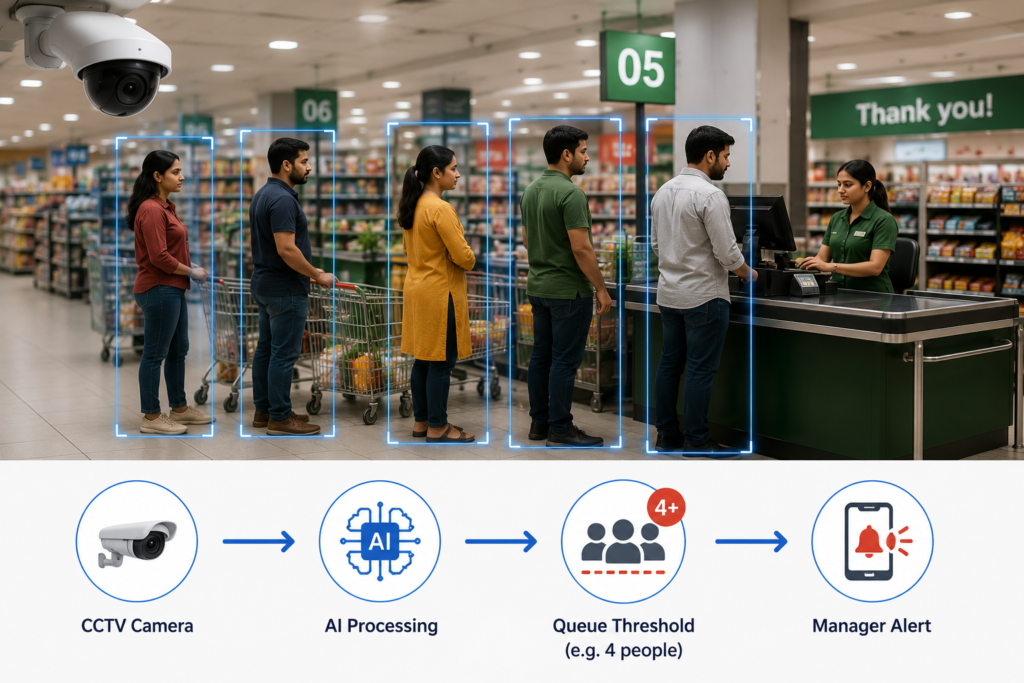
    In a market where buyers can complete the same purchase online in two taps, a long billing queue is a direct cause of walkouts. Video AI detects queue length and wait time in real time and can alert a manager to open a second counter before a browser-turned-buyer changes their mind.

    Turning browsers into buyers: from data to action

    Numbers only matter if they change what staff do. The point of electronics store footfall analytics in India is to convert measurement into a short list of daily decisions.

    Staffing is the first lever. By overlaying footfall curves across the day and week, you can roster your strongest sales associates onto the genuine peaks — typically evenings and weekends in Indian urban retail — instead of spreading cover evenly. A shopper who gets attention at the moment of indecision is far likelier to buy than one left waiting beside a locked display.

    Layout is the second. If demo-zone data shows shoppers consistently bypass a high-value accessories wall, you can relocate it into the natural traffic path revealed by the store heatmap. If a flagship table draws crowds but short dwell, you investigate the demo experience itself.

    Conversion discipline is the third. By comparing entrants against counter interactions, a manager gets a store-level conversion rate they can act on weekly — and can test whether a new window display, a staffing change, or a queue intervention actually moved the number.

    The KenVision difference: built for the store you already run

    Most Indian electronics retailers do not want a rip-and-replace project. They want more value from infrastructure already on the wall. KenVision is camera-agnostic and works with your existing CCTV, so footfall, dwell, and queue analytics run on the cameras you installed years ago rather than a costly new sensor estate. Deployment is fast, and because the platform is built privacy-first with on-premise and edge processing options, video can be analysed locally rather than streamed to an external cloud.

    That privacy-first design matters in the Indian regulatory climate. The Digital Personal Data Protection Act sharpens expectations around how personal data is handled, and an architecture that measures movement and dwell without identifying individuals — and that can keep processing on-site — gives operators a defensible footing. The analytics answer “how many, how long, where” without building shopper profiles.

    To understand where this fits in the wider picture of camera-based intelligence, see our pillar overview, What Is AI Video Analytics?, and explore the full retail analytics solution for phone, electronics, and multi-format stores.

    Getting started without overhauling the store

    A practical rollout starts small: pick one or two outlets, point the analytics at existing entrance and demo-zone cameras, and establish a baseline for capture rate, dwell, and conversion. Once managers trust the numbers and act on the daily alerts, the same approach scales across a chain, letting head office benchmark locations against each other and spread what works. Because nothing is ripped out, the path from pilot to rollout is measured in weeks, not quarters.

    Conclusion

    For Indian phone and electronics retailers, the in-store experience is the moat against online competition — but only if you can see it clearly. Electronics store footfall analytics in India turns existing cameras into a conversion engine: it shows where browsers gather, where they slip away, and where a small staffing or layout change recovers a sale. Capability, not crowds, is what compounds.

    See it on your own store floor. Book a 30-minute KenVision demo and we’ll show how your current CCTV becomes a footfall-to-buyer analytics system.

    Frequently asked questions

    Do I need new cameras for footfall analytics in my electronics store?

    No. KenVision is camera-agnostic and runs on your existing CCTV. In most stores, the entrance and demo-zone cameras already in place are enough to begin measuring capture rate, dwell time, and queue conditions.

    Is footfall analytics compliant with Indian privacy expectations?

    The platform is privacy-first and supports on-premise and edge processing, so video can be analysed locally. It measures movement, dwell, and counts rather than identifying individuals, which aligns with the direction of India’s Digital Personal Data Protection Act. You should still confirm your own signage and policy obligations.

    What is “capture rate” and why does it matter?

    Capture rate is the share of people passing your storefront who actually enter. A high-traffic location with a low capture rate usually points to a window, signage, or entrance problem — a fixable issue that conventional sales reports never surface.

    How quickly can a store see results?

    Because there is no hardware replacement, a single-store pilot can be running on existing cameras within weeks. Most operators start acting on staffing and layout insights as soon as the first reliable baselines are established.

    Can this work across multiple electronics outlets?

    Yes. Once a pilot proves out, the same analytics scale across locations so head office can benchmark stores against one another and standardise the layout and staffing tactics that convert best.

  • Crowd Density Monitoring: How AI Prevents Crush Risk at Public Events

    Crowd Density Monitoring: How AI Prevents Crush Risk at Public Events

    Public events bring together thousands and sometimes millions of people within a limited space. From religious festivals and pilgrimage routes to stadiums, political rallies, transit hubs, and concerts, managing crowd movement is one of the biggest public safety challenges. When crowd density rises too quickly or pedestrian flow slows unexpectedly, the risk of congestion, panic, and crowd crush incidents increases significantly.

    Crowd density monitoring uses AI-powered video analytics to continuously measure how many people occupy a specific area using existing CCTV cameras. Instead of relying on operators to manually monitor dozens of video feeds, the system detects overcrowding, tracks crowd movement, and sends real-time alerts before conditions become unsafe.

    This guide explains how crowd density monitoring works, why it matters, and how organizations can deploy it on existing CCTV infrastructure while maintaining privacy.


    What Is Crowd Density Monitoring?


    Crowd densitymonitoring is an AI-based video analytics solution that estimates the number of people within a defined area, typically measured as people per square metre. It continuously analyzes camera feeds to monitor crowd levels, detect congestion, and identify potential bottlenecks.

    Unlike facial recognition systems, crowd density monitoring focuses on aggregate crowd behavior, not individual identities. It measures how crowded an area is, how quickly density is changing, and whether pedestrian movement is flowing normally or slowing down.

    The key metrics include:

    • Density – Number of people occupying a specific area.
    • Flow – Direction and speed of pedestrian movement.
    • Trend – Whether crowd density is increasing, decreasing, or remaining stable.

    These insights help operations teams identify potential risks before they become emergencies.


    Why Crowd Density Monitoring Matters

    Many large venues already have extensive CCTV coverage. The challenge isn’t the lack of cameras—it’s the ability for operators to monitor every camera feed at once.

    During busy periods, control room staff can easily miss early signs of overcrowding while switching between multiple screens.

    AI-powered crowd monitoring solves this by continuously analyzing every connected camera and automatically highlighting areas where crowd density is rising beyond safe thresholds.

    Instead of reacting after congestion occurs, teams receive early warnings that allow them to:

    • Redirect pedestrian traffic
    • Open alternative entry or exit routes
    • Temporarily control inflow
    • Deploy security personnel
    • Prevent dangerous bottlenecks

    This enables a proactive rather than reactive approach to crowd management.


    Where Crowd Density Monitoring Is Used

    Crowd density monitoring is valuable anywhere large numbers of people gather.

    Common applications include:

    • Religious festivals and pilgrimage sites
    • Stadiums and sports venues
    • Railway stations and metro terminals
    • Airports
    • Concerts and live events
    • Political rallies
    • Shopping malls
    • Exhibition and convention centres
    • Smart cities and public spaces

    In each of these environments, AI provides continuous visibility into crowd conditions that would otherwise be difficult to monitor manually.


    How AI Crowd Density Monitoring Works

    The process is straightforward:

    1. Existing CCTV cameras capture live video.
    2. AI analyzes each video stream in real time.
    3. The system estimates people per square metre within predefined zones.
    4. Heat maps visualize crowded areas.
    5. Alerts are generated when density or flow crosses configured thresholds.
    6. Operators verify the alert and initiate the appropriate response.

    Because the solution works with existing IP cameras and analog cameras connected through encoders, organizations can deploy it without replacing their surveillance infrastructure.


    AI Monitoring vs Manual Monitoring

    Manual Monitoring AI Crowd Density Monitoring
    Operators monitor multiple screens Every camera is analyzed continuously
    Relies on human observation Detects risks automatically
    Easy to miss developing congestion Real-time alerts before overcrowding
    Reactive response Proactive intervention
    Difficult to scale Supports hundreds of cameras simultaneously

    Rather than replacing security teams, AI helps them focus on the locations that require immediate attention.


    Benefits of Crowd Density Monitoring

    Organizations adopting AI-powered crowd monitoring gain several operational advantages:

    • Detect overcrowding before it becomes dangerous
    • Monitor pedestrian movement in real time
    • Identify bottlenecks and congestion
    • Improve emergency response times
    • Reduce operator fatigue
    • Generate historical crowd analytics
    • Improve event planning and resource allocation
    • Use existing CCTV infrastructure
    • Support privacy-first deployments

    These capabilities improve both public safety and operational efficiency.


    Deploying on Existing CCTV Infrastructure

    One of the biggest advantages of modern crowd density monitoring is that it works with existing surveillance systems.

    Organizations can integrate AI with their current IP cameras or analog cameras without replacing hardware.

    Edge or on-premises deployment keeps video processing inside the organization’s network, reducing latency while avoiding the need to stream large volumes of footage to the cloud.

    This approach offers:

    • Faster alert generation
    • Lower bandwidth usage
    • Better data security
    • Improved operational reliability
    • Easier compliance with privacy requirements

    For temporary events such as festivals or concerts, the system can also be deployed on portable edge devices for the duration of the event.


    Privacy by Design

    Crowd density monitoring does not require facial recognition.

    The system analyzes crowd movement and occupancy levels rather than identifying individuals. It generates aggregated insights such as density, flow, and congestion instead of collecting personal information.

    Processing video on-premises further strengthens privacy by ensuring footage remains within the organization’s network while still delivering real-time analytics.

    This makes AI crowd monitoring a practical solution for organizations seeking to improve public safety while respecting privacy requirements.


    Getting Started

    Most organizations begin with a small deployment focused on high-risk locations such as entrances, exits, footbridges, or transit corridors.

    After calibrating density thresholds for each location and integrating alerts into the control room workflow, the solution can gradually expand across the venue.

    Because AI works with existing CCTV infrastructure, organizations can improve crowd safety without significant hardware investment.


    Frequently Asked Questions

    What is crowd density monitoring?

    Crowd density monitoring uses AI and CCTV cameras to estimate how many people occupy a defined area in real time. It helps identify overcrowding, monitor pedestrian flow, and generate early warnings before safety risks develop.

    Does crowd density monitoring identify people?

    No. The technology measures crowd density and movement patterns rather than identifying individual people, making it suitable for privacy-focused deployments.

    Can it work with existing CCTV cameras?

    Yes. Most AI crowd monitoring platforms integrate with existing IP cameras and analog cameras connected through encoders, allowing organizations to upgrade their surveillance systems without replacing hardware.

    How are alerts generated?

    Alerts are triggered when crowd density or pedestrian flow exceeds predefined thresholds. Operators receive real-time notifications so they can respond before congestion becomes critical.

    Which industries benefit from crowd density monitoring?

    The technology is widely used in public events, stadiums, transportation hubs, smart cities, shopping malls, airports, religious venues, and large public spaces where crowd safety is essential.


    Improve Crowd Safety with AI

    Real-time crowd density monitoring gives operations teams the visibility they need to respond before congestion turns into a safety incident. By combining AI-powered video analytics with existing CCTV infrastructure, organizations can improve crowd management, reduce operational risk, and enhance public safety without replacing their surveillance systems.

    Whether you’re managing a stadium, transit hub, public event, or smart city project, AI-powered crowd monitoring helps transform CCTV from a passive recording system into an intelligent early-warning solution.

  • AI PPE Detection for Construction Sites in India | Real-Time CCTV Safety Monitoring

    AI PPE Detection for Construction Sites in India | Real-Time CCTV Safety Monitoring

    Every day, thousands ofworkers step onto construction sites across India, where safety is a shared responsibility. Yet even with established protocols, a single missing hard hat or safety harness can increase the risk of serious incidents. Ensuring every worker consistently wears the required personal protective equipment (PPE) is challenging, especially on large, fast-moving projects.

    This is where AI PPE Detectionis changing the way construction companies approach safety. By combining existing CCTV infrastructure with AI-powered video analytics, organizations can automatically monitor PPE compliance in real time, helping safety teams respond faster and improve overall site safety.


    Why PPE Compliance Matters

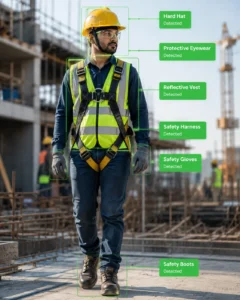
    Construction remains one of the most safety-critical industries. Workers are exposed to hazards such as working at heights, heavy machinery, falling objects, electrical risks, and moving vehicles. Personal protective equipment—including hard hats, reflective safety vests, safety harnesses, gloves, and safety boots plays a vital role in reducing these risks.

    While regular inspections help, manual monitoring has limitations:

    • Large construction sites are difficult to supervise continuously.
    • Safety officers cannot be present everywhere at once.
    • PPE violations may go unnoticed between inspections.
    • Managing multiple contractors can make consistent enforcement more challenging.

    Continuous monitoring can complement manual inspections by improving visibility across the site.


    What Is AI PPE Detection?

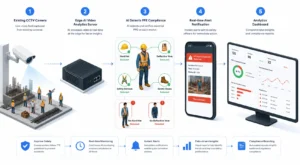
    AI PPE Detection uses computer vision and artificial intelligence to automatically identify whether workers are wearing the required safety equipment.

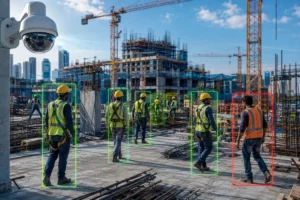
    Instead of relying solely on periodic inspections, the system continuously analyzes video feeds from existing CCTV cameras. When a worker enters a monitored area without the required PPE, the system generates an alert, allowing supervisors to take prompt action.

    This enables construction companies to improve compliance without replacing their existing camera infrastructure.


    How AI PPEDetection Works

    The process is simpleand integrates with existing surveillance systems:

    1. Existing CCTV cameras capture live video from the construction site.
    2. An on-premise or edge AI engine processes the footage in real time.
    3. The AI model detects PPE, such as:
      • Safety helmets
      • Reflective vests
      • Safety harnesses
      • Safety shoes
    4. If non-compliance is detected, the system sends:
      • Instant alerts
      • Compliance notifications
      • Event logs for reporting and audits

    Since video processing can happen locally on-site, organizations can keep footage within their own network while storing only alerts or compliance records, depending on their deployment requirements.


    PPE Items AI Can Detect

    Modern AI video analytics systems can recognize a wide range of safety equipment, including:

    • Safety Helmets
    • Reflective Safety Vests
    • Full Body Safety Harnesses
    • Safety Shoes
    • Gloves
    • Face Masks (where required)

    The system continuously checks compliance across monitored areas, helping safety teams identify violations more efficiently.


    Benefits of AI PPE Detection

    Improve Worker Safety

    Real-time monitoring helps identify missing PPE sooner, enabling quicker intervention before work continues.

    Strengthen PPE Compliance

    Continuous monitoring supports consistent enforcement of safety policies across teams, contractors, and shifts.

    Faster Incident Response

    Immediate notifications allow supervisors to respond promptly when non-compliance is detected.

    Reduce Manual Monitoring

    AI complements safety officers by monitoring multiple camera feeds simultaneously, allowing teams to focus on higher-value safety activities.

    Simplify Safety Audits

    Automatically generated compliance logs can support safety reporting, investigations, and audit preparation.

    Scale Across Multiple Sites

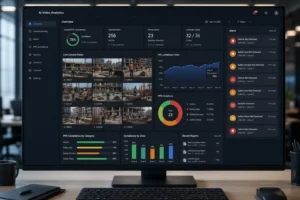
    Organizations can monitor multiple construction projects from a centralized dashboard, making it easier to maintain consistent safety standards.


    Where AI PPE Detection Can Be Used

    Although widely adopted on construction sites, AI PPE detection is also valuable in:

    • Infrastructure Projects
    • Manufacturing Facilities
    • Warehouses
    • Industrial Plants
    • Logistics Hubs
    • Mining Operations
    • Oil & Gas Facilities
    • Power Plants

    Any environment where PPE compliance is essential can benefit from AI-assisted monitoring.


    Why Edge AI Matters

    Many organizations have concerns about data privacy and network bandwidth.

    With edge AI, video is processed locally at the site instead of being continuously transmitted to the cloud. This can reduce latency, improve response times, and support organizations that prefer to keep video data on-premises.


    The Future of Construction Safety

    As construction projects become larger and more complex, maintaining high safety standards requires tools that can provide continuous visibility. AI PPE detection helps safety teams monitor compliance more effectively by turning existing CCTV systems into intelligent monitoring solutions.

    While AI does not replace safety officers, it acts as an additional layer of oversight—helping organizations identify potential issues earlier and support a stronger culture of workplace safety.


    Conclusion

    AI PPE Detection is transforming how construction companies monitor worker safety. By leveraging existing CCTV cameras and AI-powered video analytics, organizations can improve PPE compliance, reduce manual monitoring efforts, and gain better visibility across their sites.

    For companies looking to strengthen construction safety while making better use of their existing surveillance infrastructure, AI PPE detection offers a practical and scalable approach to supporting safer


  • Retail Footfall Analytics in India: A 2026 Playbook for Store Operators

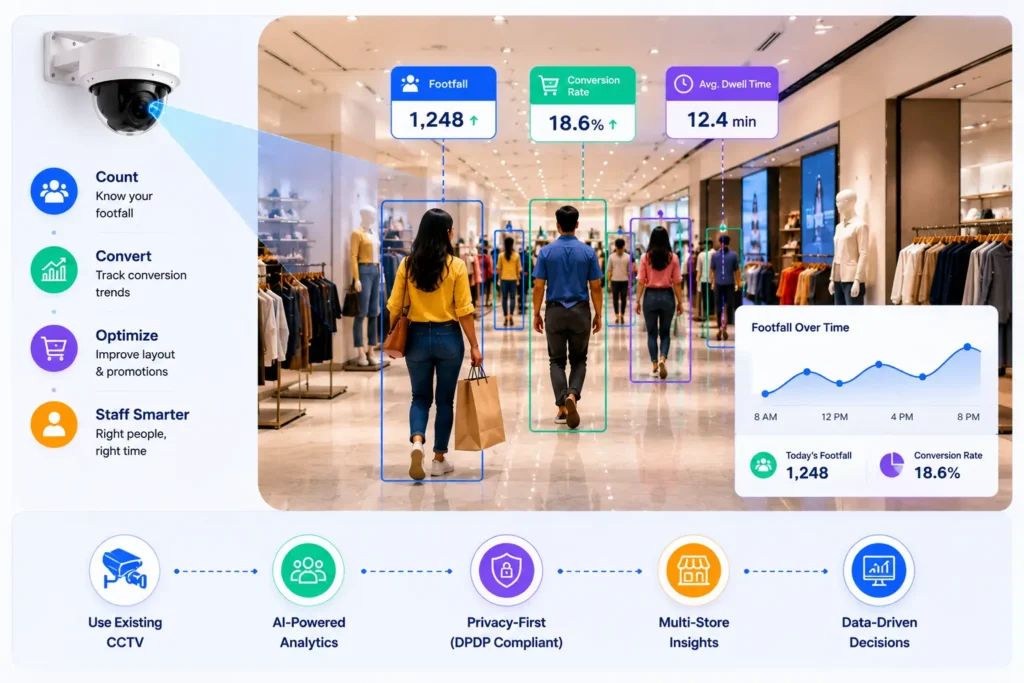
    Retail footfall analytics in India has moved from a big-format luxury to an operational baseline. As organised retail expands across tier-1 metros and fast-growing tier-2 cities, store operators can no longer run promotions, rosters, and layouts on intuition alone.

    The cameras are already on the wall; what changes in 2026 is the ability to turn that existing CCTV feed into reliable counts, conversion signals, and staffing decisions — without a costly hardware refresh and without compromising customer privacy.

    This playbook explains how retail footfall analytics works in the Indian context, the metrics that matter, the privacy obligations under the DPDP Act, and a practical rollout sequence you can follow across a multi-store estate.

    Why retail footfall analytics matters more in India in 2026

    Indian retail is uniquely seasonal and uniquely diverse. A single chain may run flagship stores in Mumbai or Bengaluru alongside compact outlets in Jaipur or Coimbatore, each with different traffic rhythms.

    Festive peaks — Diwali, Eid, regional new-year sales — can swing daily footfall by multiples, and a roster built for an average week collapses under a festive Saturday.

    Footfall analytics replaces guesswork with an hourly demand curve per store, so managers staff the floor to actual traffic rather than to a fixed shift template.

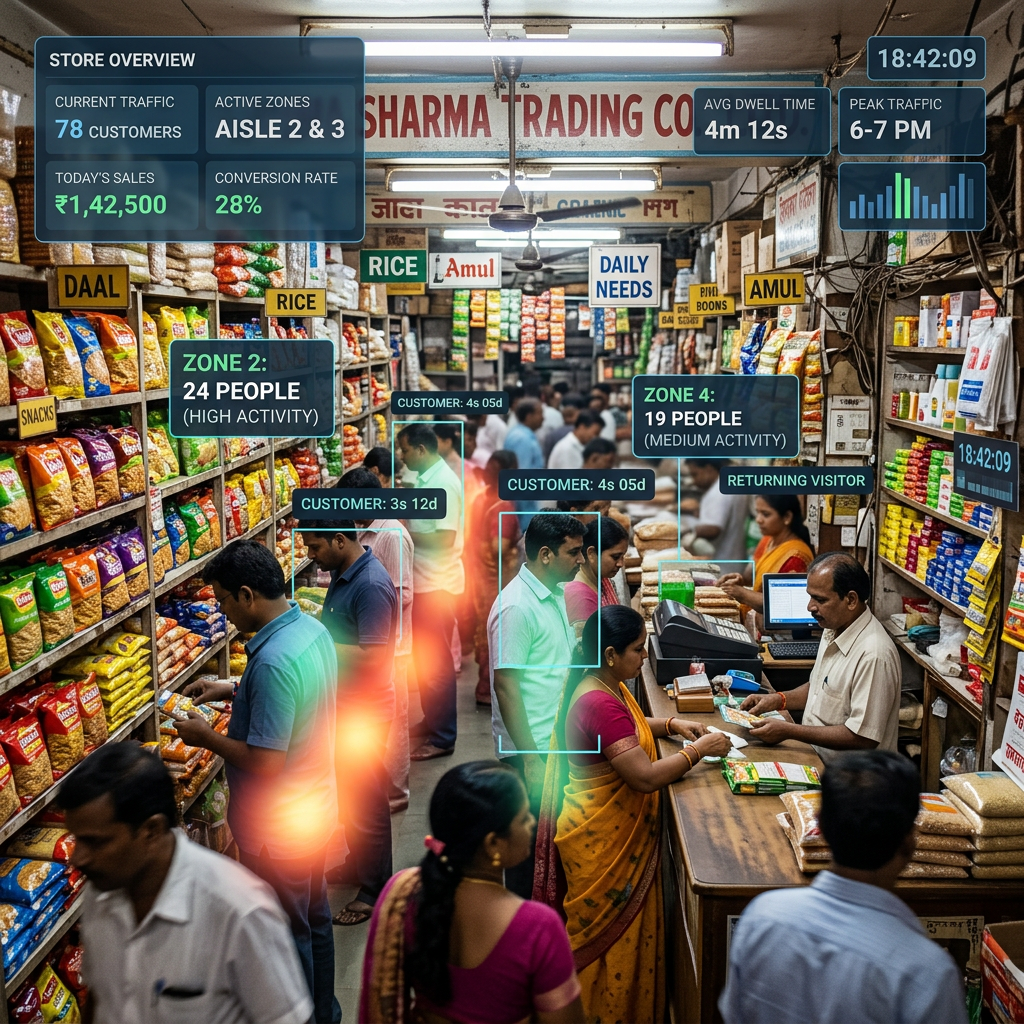
    Inside a busy retail store showing customers shopping with analytics data overlays including customer count, zone activity, sales, and time
    A busy retail store with real-time customer activity and sales data overlays

    The second pressure is margin. With rents and staffing costs rising in prime high streets and malls, operators need to know not just how many people entered, but how many converted.

    A store that pulls heavy footfall yet converts poorly has a layout, staffing, or assortment problem — and footfall data is what lets you tell those apart.

    How footfall counting works on your existing cameras

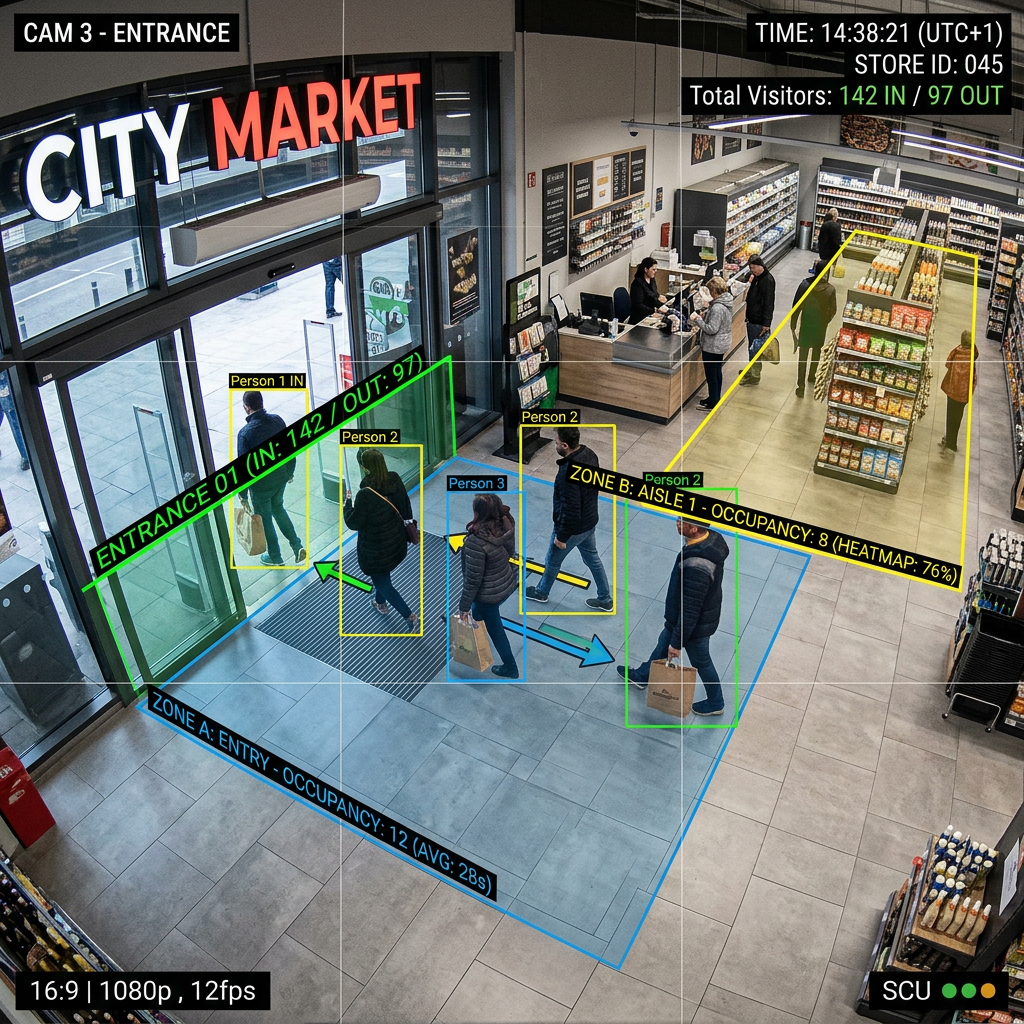
    Supermarket entrance with customers tracked by foot traffic and occupancy monitoring system
    People entering and shopping inside City Market with visitor tracking overlays

    Modern video AI does not require specialist sensors or door-mounted beam counters. It reads the feed from cameras you already operate.

    An entrance camera detects and counts people crossing a virtual line; in-store cameras segment the floor into zones and measure how long shoppers dwell in each.

    Because the analytics run on the video stream, the same infrastructure that records for security now produces operational intelligence.

    This camera-agnostic, retrofit approach is the fastest path to value — there is no rip-and-replace, and most stores can be live in days rather than months.

    For a deeper primer on the underlying technology, see our guide to what AI video analytics is and how it works, and the practical walkthrough of footfall counting on existing CCTV.

    Accuracy in Indian stores depends on a few real-world factors: camera height and angle at the entrance, glass-frontage glare in mall units, and crowding during peaks.

    A good deployment tunes counting lines per store rather than applying one template across the estate, and validates counts against manual spot-checks in the first weeks.

    The metrics that actually drive decisions

    Footfall on its own is a vanity number. The metrics that change behaviour are the ones that connect traffic to outcomes:

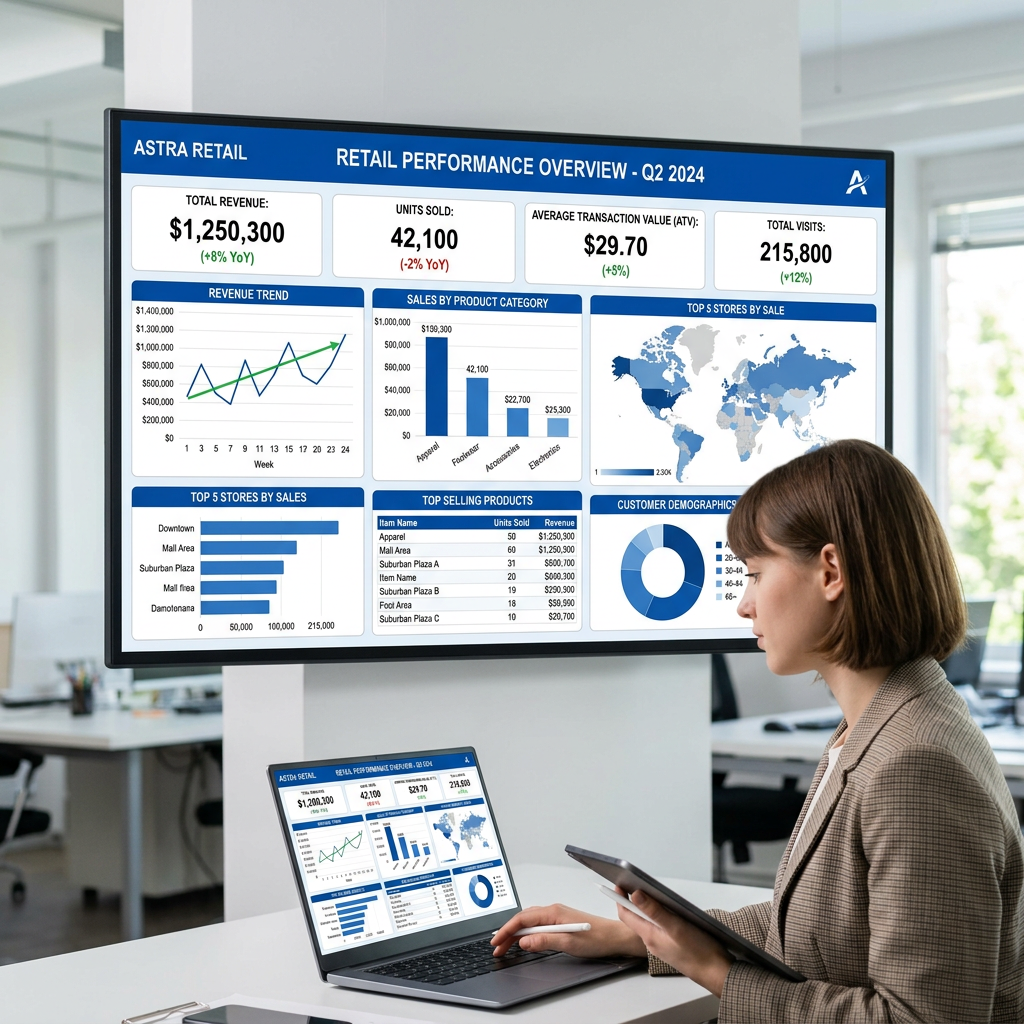
    Business analyst reviewing retail performance dashboard for Q2 2024 with sales, revenue, and demographics data
    A business analyst reviews Astra Retail’s Q2 2024 performance data on multiple screens
    • Entry count by hour and day: the demand curve that drives rostering and break scheduling.
    • Capture rate: the share of mall or high-street passers-by who actually enter — a direct read on your window, signage, and offer.
    • Zone dwell time: where shoppers linger, which tells you whether your best merchandise sits where attention concentrates.
    • Conversion rate: transactions divided by visitors, the single most important number for comparing stores fairly.
    • Staff-to-traffic ratio: whether the floor is covered when demand peaks, or over-staffed when it does not.

    Comparing conversion across a multi-store estate is where the strategy emerges. Two outlets with identical footfall but different conversion reveal exactly where to invest coaching, assortment, or layout changes.

    Heatmaps make the same point visually — if you are new to reading them, our explainer on retail store heatmaps and how to act on them is a useful companion.

    Privacy-first by design: footfall analytics and the DPDP Act

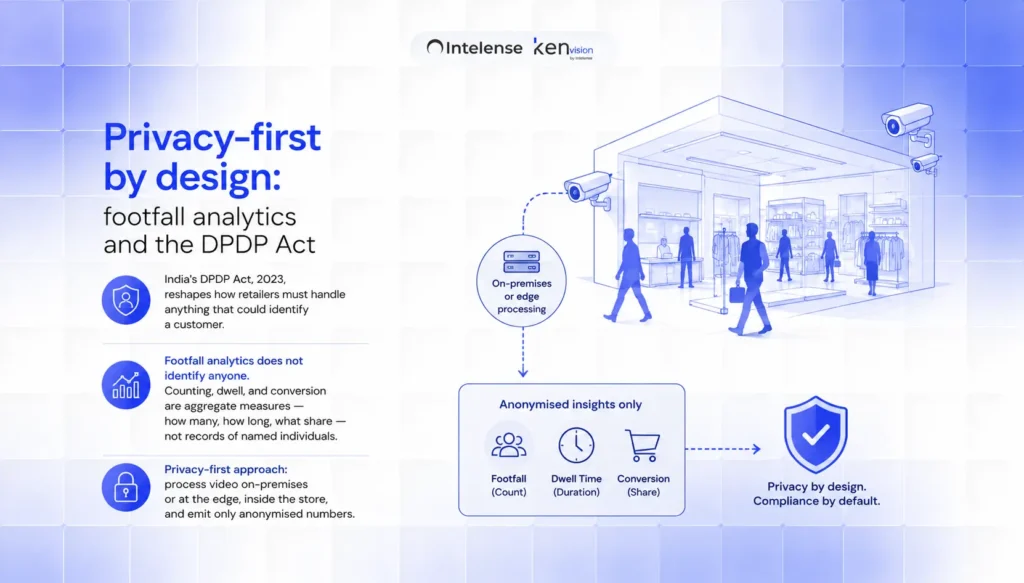
    India’s Digital Personal Data Protection Act, 2023, reshapes how retailers must handle anything that could identify a customer.

    The good news is that operational footfall analytics does not need to identify anyone. Counting, dwell, and conversion are aggregate measures — how many, how long, what share — not records of named individuals.

    The privacy-first approach that suits Indian retail processes video on-premises or at the edge, inside the store, and emits only anonymised numbers.

    Raw faces never leave the building, identities are not stored, and the analytics layer keeps counts rather than personal data. This on-prem, data-sovereignty-friendly design both reduces DPDP exposure and reassures customers.

    Where demographic breakdowns (such as approximate age band or gender split for a brand activation) are needed, they should be produced as anonymised, non-identifying aggregates rather than profiles tied to a person.

    A practical multi-store rollout sequence

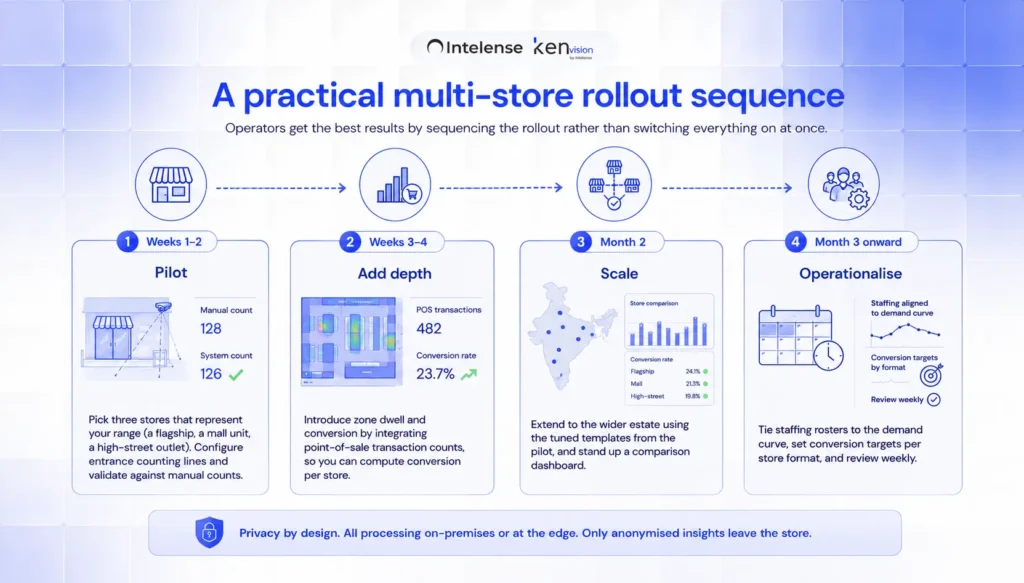
    Operators get the best results by sequencing the rollout rather than switching everything on at once:

    • Weeks 1–2 — Pilot: pick three stores that represent your range (a flagship, a mall unit, a high-street outlet). Configure entrance counting lines and validate against manual counts.
    • Weeks 3–4 — Add depth: introduce zone dwell and conversion by integrating point-of-sale transaction counts, so you can compute conversion per store.
    • Month 2 — Scale: extend to the wider estate using the tuned templates from the pilot, and stand up a comparison dashboard.
    • Month 3 onward — Operationalise: tie staffing rosters to the demand curve, set conversion targets per store format, and review weekly.

    Because the system runs on existing cameras, scaling is largely a software and configuration exercise rather than a capital project — which is what makes estate-wide deployment realistic on a retail timeline.

    You can see how this maps to specific store types on our retail analytics solution page.

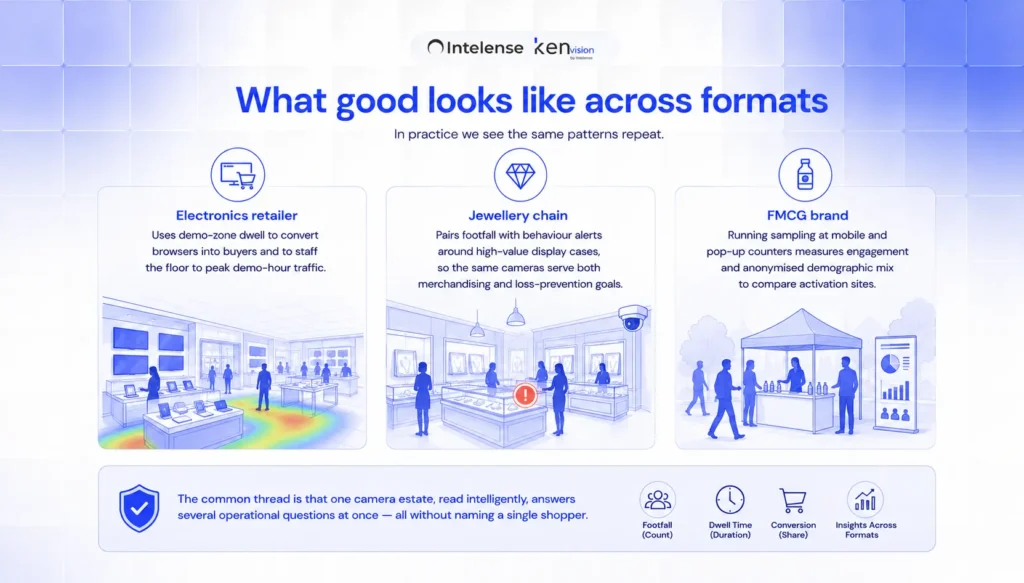
    What good looks like across formats

    In practice we see the same patterns repeat. A national electronics retailer uses demo-zone dwell to convert browsers into buyers and to staff the floor to peak demo-hour traffic.

    A jewellery chain pairs footfall with behaviour alerts around high-value display cases, so the same cameras serve both merchandising and loss-prevention goals.

    A leading FMCG brand running sampling at mobile and pop-up counters measures engagement and anonymised demographic mix to compare activation sites.

    The common thread is that one camera estate, read intelligently, answers several operational questions at once — all without naming a single shopper.

    Getting started

    If you operate retail across Indian cities and your cameras are already in place, you are most of the way to a footfall analytics programme. Start with a focused pilot, prove conversion lift in a handful of stores, and scale on the evidence.

    To see how KenVision turns your existing CCTV into privacy-first footfall, dwell, and conversion intelligence, book a 30-minute demo.

    Frequently asked questions

    Do I need new cameras for retail footfall analytics in India?

    No. The analytics run on your existing CCTV feeds. The approach is camera-agnostic and retrofit-friendly, so most stores go live without buying new hardware, and entrance counting lines are simply tuned per store.

    Is footfall analytics compliant with the DPDP Act?

    It can be designed to be. Operational footfall, dwell, and conversion are aggregate counts rather than personal data. Processing video on-premises or at the edge and storing only anonymised numbers — never identities — keeps the system aligned with DPDP principles. Any demographic breakdowns should be produced as non-identifying aggregates.

    How accurate is camera-based footfall counting?

    With cameras positioned and tuned correctly, modern video AI delivers reliable entry counts suitable for staffing and conversion analysis. Accuracy depends on entrance camera angle, lighting, and crowding, which is why a good rollout validates counts against manual checks during the pilot weeks.

    How quickly can a multi-store chain deploy?

    A representative three-store pilot can be live within a couple of weeks, with estate-wide scaling over the following one to two months. Because it runs on existing cameras, deployment is mostly configuration rather than a capital hardware project.

    What is the difference between footfall and conversion?

    Footfall counts how many people enter; conversion is transactions divided by visitors. Footfall tells you about reach and traffic; conversion tells you how effectively the store turns that traffic into sales — which is the fairer way to compare stores of different sizes and locations.

  • Occupancy Analytics for Commercial Buildings in Canada: A PIPEDA-Safe Guide

    Occupancy analytics for commercial buildings in Canada has moved from a nice-to-have to a line item facilities and real-estate leaders defend in every budget review.

    With hybrid work now the norm in Toronto, Vancouver, Calgary and Montreal towers, the question is no longer “how many desks do we have?” but “how many of them are actually used, when, and by how many people?” Badge swipes and lease square-footage can no longer answer that.

    Video-based occupancy analytics can — and when it is built privacy-first, it does so without ever identifying a single person.

    This guide explains how AI video analytics turns the cameras already installed in your building into an accurate, real-time occupancy sensor, how that maps onto Canada’s privacy framework, and what to look for before you deploy.


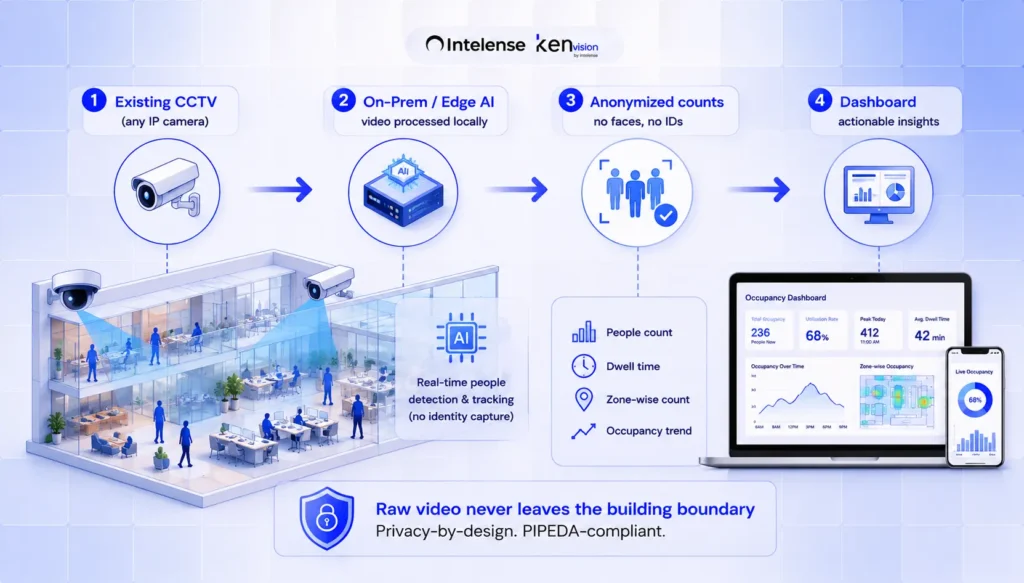
    Existing CCTV
    (any IP camera)

    On-Prem / Edge AI
    video processed locally

    Anonymized counts
    no faces, no IDs

    Dashboard
    Raw video never leaves the building boundary

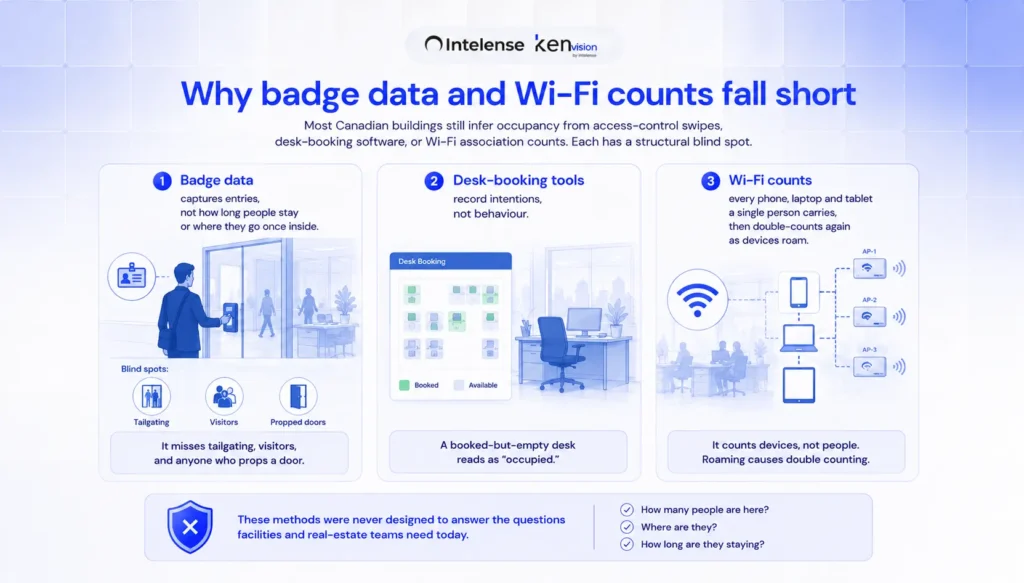
    Why badge data and Wi-Fi counts fall short

    Most Canadian buildings still infer occupancy from access-control swipes, desk-booking software, or Wi-Fi association counts. Each has a structural blind spot.

    Badge data captures entries, not how long people stay or where they go once inside — and it misses tailgating, visitors, and anyone who props a door.

    Desk-booking tools record intentions, not behaviour; a booked-but-empty desk reads as “occupied.” Wi-Fi counts every phone, laptop and tablet a single person carries, then double-counts again as devices roam between access points.

    The result is occupancy figures that are confidently wrong, often by 20–40%. When a single floor in a downtown tower can cost millions a year, decisions about renewals, consolidation and fit-outs deserve a measured number, not an inferred one.

    What occupancy analytics actually measures

    AI video analytics counts people, not proxies.

    By applying computer-vision models to standard camera feeds, the system produces a continuous, time-stamped picture of how a building is really used: live headcount per floor or zone, peak and average occupancy by hour and day, dwell time in meeting rooms and collaboration areas, entry/exit flow at lobbies and stairwells, and the gap between booked and actually-used spaces.

    For a fuller primer on the underlying technology, see our pillar guide, What Is AI Video Analytics?

    Crucially, none of this requires identifying anyone. A well-designed system detects the presence and movement of a human form and increments a count.

    It does not need a name, a face match, or a device ID to tell you that Meeting Room 4 sat empty for 80% of last week.

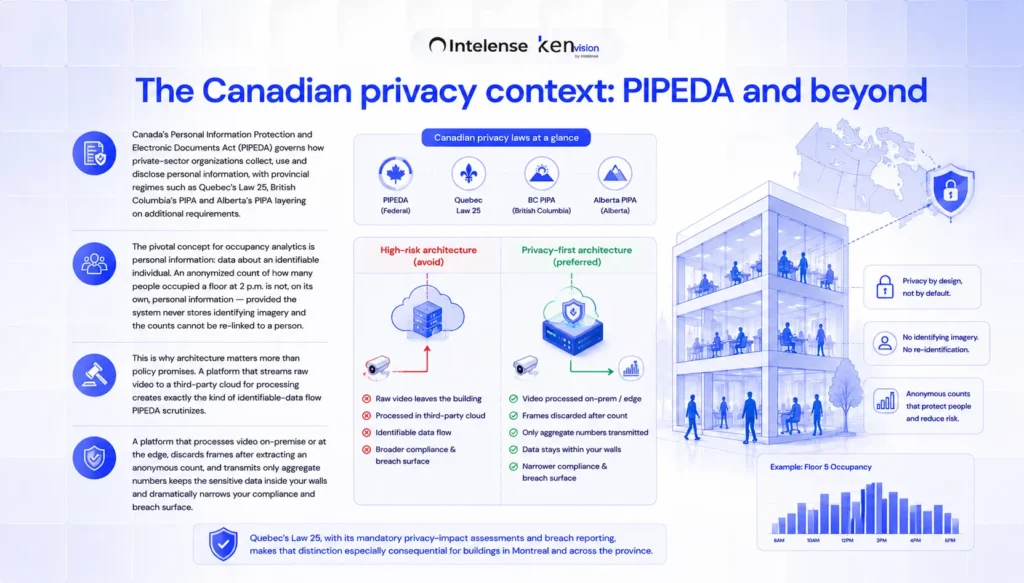
    The Canadian privacy context: PIPEDA and beyond

    Canada’s Personal Information Protection and Electronic Documents Act (PIPEDA) governs how private-sector organizations collect, use and disclose personal information, with provincial regimes such as Quebec’s Law 25, British Columbia’s PIPA and Alberta’s PIPA layering on additional requirements.

    The pivotal concept for occupancy analytics is personal information: data about an identifiable individual. An anonymized count of how many people occupied a floor at 2 p.m. is not, on its own, personal information — provided the system never stores identifying imagery and the counts cannot be re-linked to a person.

    This is why architecture matters more than policy promises. A platform that streams raw video to a third-party cloud for processing creates exactly the kind of identifiable-data flow PIPEDA scrutinizes.

    A platform that processes video on-premise or at the edge, discards frames after extracting an anonymous count, and transmits only aggregate numbers keeps the sensitive data inside your walls and dramatically narrows your compliance and breach surface.

    Quebec’s Law 25, with its mandatory privacy-impact assessments and breach reporting, makes that distinction especially consequential for buildings in Montreal and across the province.

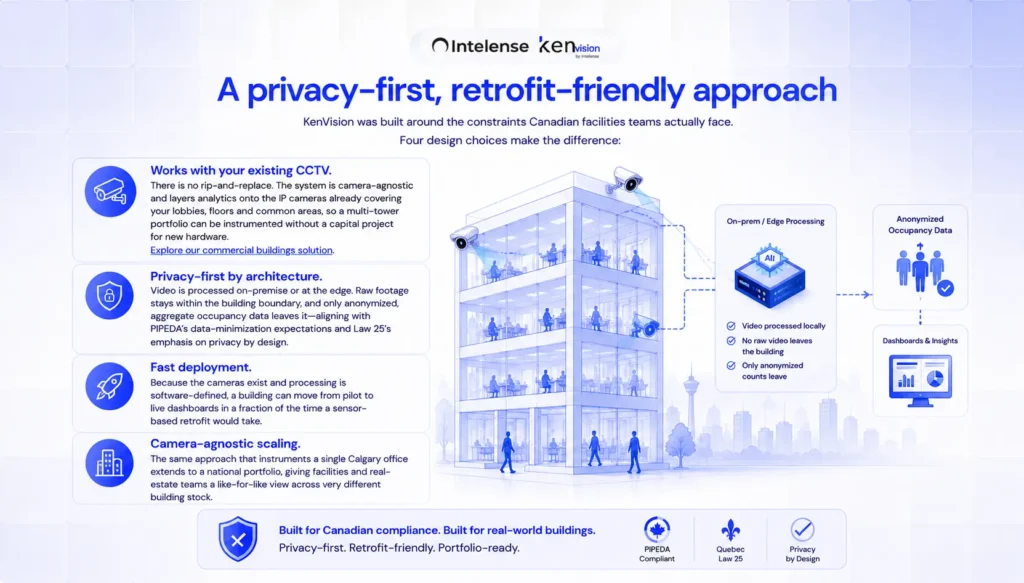
    A privacy-first, retrofit-friendly approach

    KenVision was built around the constraints Canadian facilities teams actually face. Four design choices make the difference:

    Works with your existing CCTV: There is no rip-and-replace. The system is camera-agnostic and layers analytics onto the IP cameras already covering your lobbies, floors and common areas, so a multi-tower portfolio can be instrumented without a capital project for new hardware. Our commercial buildings solution is designed specifically for this retrofit path.

    Privacy-first by architecture: Video is processed on-premise or at the edge. Raw footage stays within the building boundary, and only anonymized, aggregate occupancy data leaves it — aligning with PIPEDA’s data-minimization expectations and Law 25’s emphasis on privacy by design.

    Fast deployment: Because the cameras exist and processing is software-defined, a building can move from pilot to live dashboards in a fraction of the time a sensor-based retrofit would take.

    Camera-agnostic scaling: The same approach that instruments a single Calgary office extends to a national portfolio, giving facilities and real-estate teams a like-for-like view across very different building stock.

    What teams do with the data

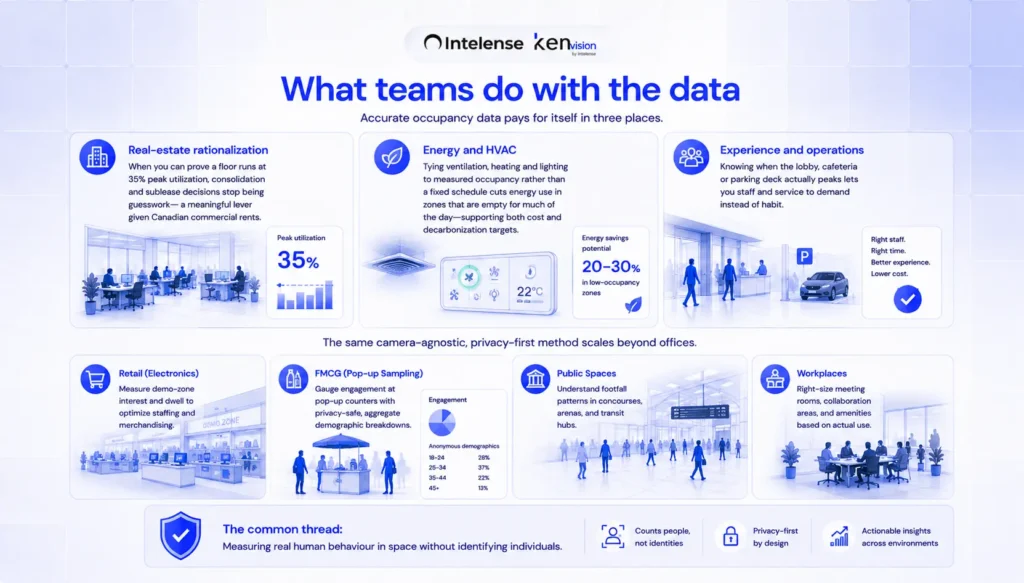
    Accurate occupancy data pays for itself in three places.

    Real-estate rationalization: when you can prove a floor runs at 35% peak utilization, consolidation and sublease decisions stop being guesswork — a meaningful lever given Canadian commercial rents.

    Energy and HVAC: tying ventilation, heating and lighting to measured occupancy rather than a fixed schedule cuts energy use in zones that are empty for much of the day, supporting both cost and decarbonization targets.

    Experience and operations: knowing when the lobby, cafeteria or parking deck actually peaks lets you staff and service to demand instead of habit.

    The same camera-agnostic, privacy-first method scales beyond offices.

    Operators have used comparable approaches to understand engagement and footfall across very different environments — from a national electronics retailer measuring demo-zone interest, to a leading FMCG brand gauging engagement at pop-up sampling counters with privacy-safe, aggregate demographic breakdowns.

    The common thread is measuring real human behaviour in space without identifying individuals.

    Getting started

    A sensible pilot starts with one building or a representative floor, a clear baseline question (“what is our true peak occupancy versus our lease assumption?”), and a short list of zones that matter.

    Because the analytics ride on existing cameras, the pilot is low-risk and reversible. From there, the same configuration template extends across the portfolio.

    See how occupancy analytics would work on your existing cameras — book a 30-minute demo.

    Frequently asked questions

    Is video-based occupancy analytics legal under PIPEDA?

    Yes, when implemented correctly. PIPEDA regulates personal information about identifiable individuals.

    A system that produces only anonymized, aggregate counts — processing video on-premise and never storing identifying imagery — minimizes the collection of personal information.

    Organizations should still complete a privacy assessment, post appropriate notices, and document their data flows, and Quebec operators should account for Law 25’s privacy-impact-assessment requirements.

    Do we need to install new cameras or sensors?

    Generally no. The approach is camera-agnostic and retrofits onto existing IP CCTV, avoiding a rip-and-replace hardware project. Coverage gaps in specific zones can be addressed selectively rather than rebuilding the whole estate.

    How is this more accurate than badge or Wi-Fi data?

    Badge data counts entries, not presence or movement, and misses tailgating and visitors. Wi-Fi counts devices, not people, and double-counts roaming. Video analytics counts the people actually present in a zone over time, which is why it typically corrects occupancy estimates that other methods get wrong by 20–40%.

    Does the system store recordings of employees?

    In a privacy-first deployment, raw video is processed locally and discarded after an anonymous count is extracted; only aggregate numbers are retained. This keeps identifiable data inside the building and reduces both compliance and breach risk.

    How quickly can a building go live?

    Because the cameras already exist and processing is software-defined, deployment is fast — a single building can typically move from pilot to live dashboards far quicker than a sensor-based retrofit.

  • AI Theft Detection for Jewellery Stores in India: Cutting Shrinkage in High-Value Showrooms

    AI theft detection for jewellery stores in India is moving from a luxury to an operational baseline. Gold and diamond showrooms across the country carry extraordinary value density on the shop floor — a single display tray can hold more stock than an entire FMCG aisle — yet most still rely on a guard, a panic button, and hours of CCTV nobody watches until after a loss. The result is shrinkage that surfaces only at stock-take, and incidents that are reconstructed rather than prevented. AI video analytics changes the timing: it watches every camera continuously and flags suspicious behaviour around high-value cases while it is happening, so staff can respond in the moment.

    This guide explains how AI theft detection works in an Indian jewellery retail context, what it can and cannot do, and how to deploy it without ripping out the cameras you already own.

    Why jewellery retail is a special case

    Most retail analytics is about turning browsers into buyers. Jewellery shares that goal, but it carries a second, heavier mandate: loss prevention on goods where a single item can be worth lakhs. Indian showrooms also run a distinctive operating pattern — long dwell times at the counter, family groups, festival and wedding-season surges, and staff who must handle open stock face to face with customers. That mix makes traditional rules-based security brittle. A motion sensor cannot tell a legitimate try-on from a grab, and a guard watching one entrance cannot see a distraction play unfolding at a side counter.

    AI video analytics is built for exactly this ambiguity. Instead of tripwires, it models behaviour: how long a person lingers at a case, whether multiple people coordinate to occupy staff, when a display is opened and by whom, and whether someone is paying unusual attention to the back of a counter. For a deeper primer on the underlying technology, see our pillar guide, What Is AI Video Analytics?

    What AI theft detection actually watches for

    Suspicious behaviour and loitering

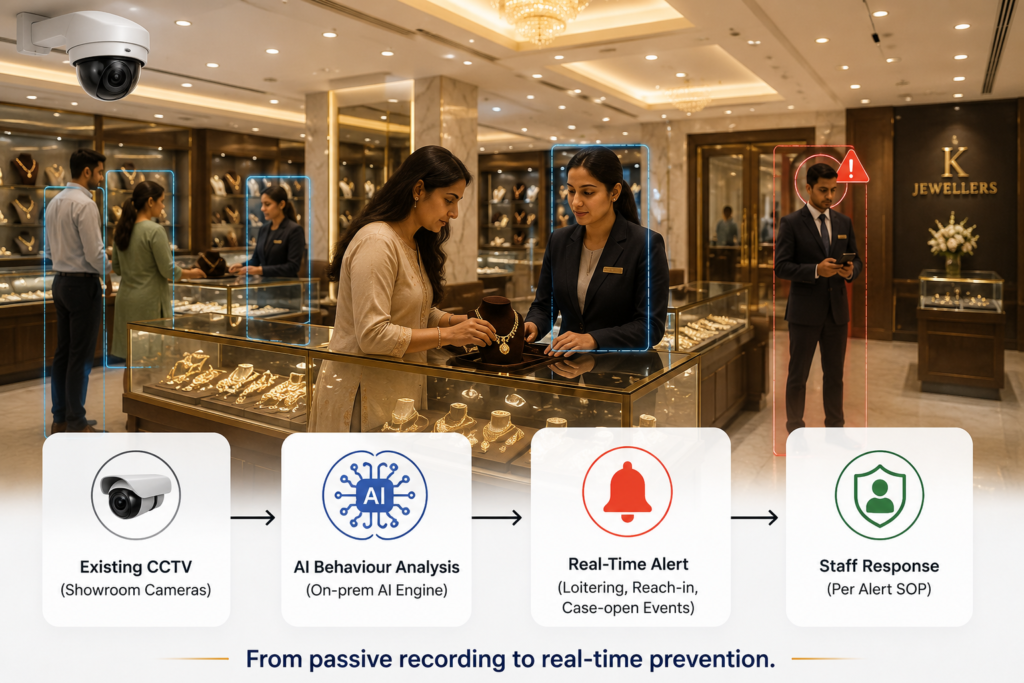
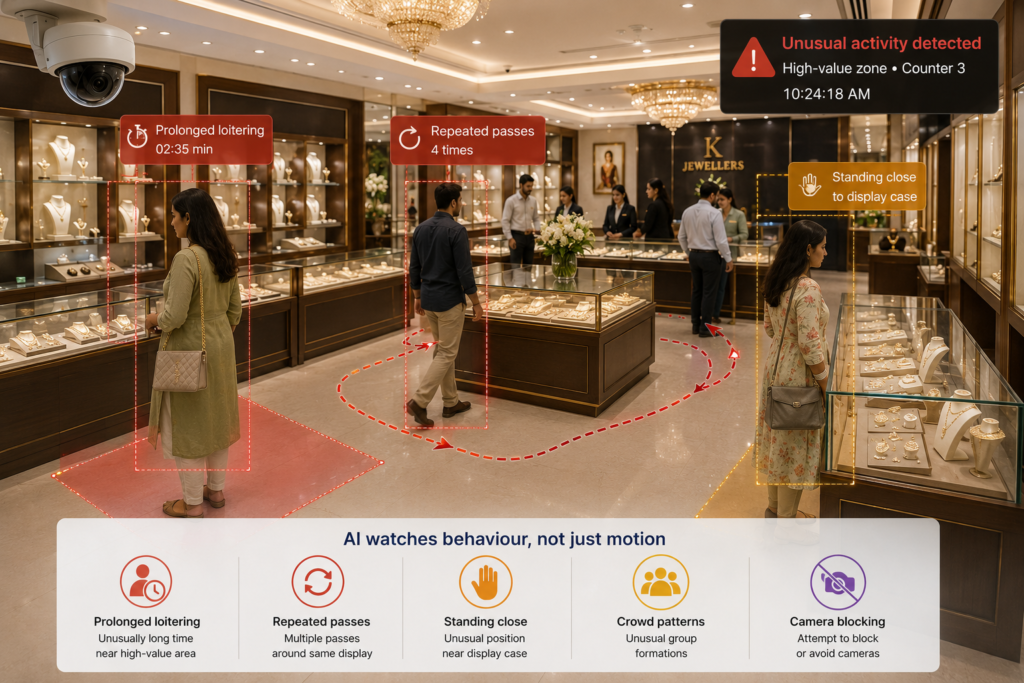
    The system establishes what normal looks like at each zone — entrance, counter, billing, display wall — and surfaces deviations. Prolonged loitering near a high-value case without staff engagement, repeated passes past the same display, or a person positioning to block a camera or a colleague’s line of sight all generate a graded alert rather than a binary alarm.

    Reach-in and case-open events

    Around display cases, the analytics can flag when a case is opened, when a hand crosses into a case that should be staff-controlled, or when an item is removed and not returned within an expected window. These are the moments that matter most, and they are precisely the ones a human monitor misses during a busy Saturday rush.

    Coordinated distraction patterns

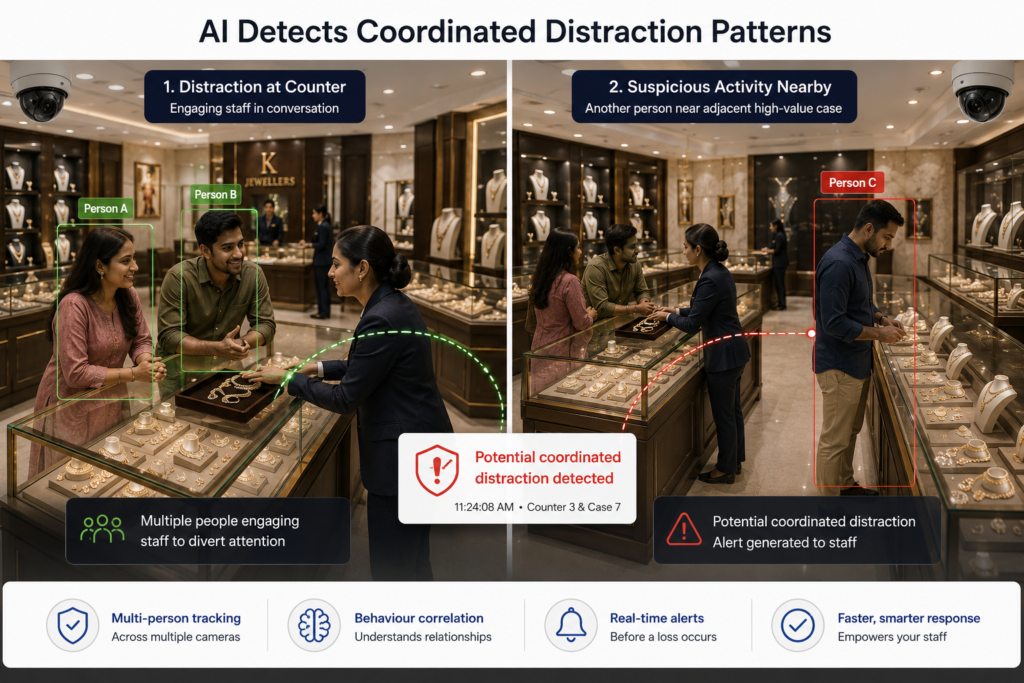
    Organised theft in jewellery retail frequently relies on splitting staff attention. By tracking multiple people at once across multiple cameras, AI can recognise the signature of a distraction play — one group monopolising a counter while another works an adjacent case — and alert before the second move completes.

    Beyond detection: standardised response

    Catching an event is only half the value. The other half is making sure every alert triggers the same, calm, trained response — not improvisation. A good deployment pairs detection with a written alert SOP so a junior staffer at 11 a.m. responds exactly as the floor manager would. We cover this in detail in Building an Alert SOP for Jewellery Retail, and the case-specific protections in Protecting High-Value Display Cases with Video AI. The combination — reliable detection plus a rehearsed SOP — is what turns analytics into measurably lower shrinkage.

    Privacy and compliance in the Indian context

    Jewellery showrooms handle footage of customers, many of them regulars, and increasingly must account for India’s Digital Personal Data Protection (DPDP) Act when they process that footage. A privacy-first architecture matters here: processing video on-premise or at the edge means raw footage never has to leave the store, faces need not be retained, and demographic or behavioural signals can be derived without exporting identifiable data to a third-party cloud. This keeps data sovereignty in your hands and simplifies the consent and retention story you owe customers and regulators.

    Deploying without a rip-and-replace

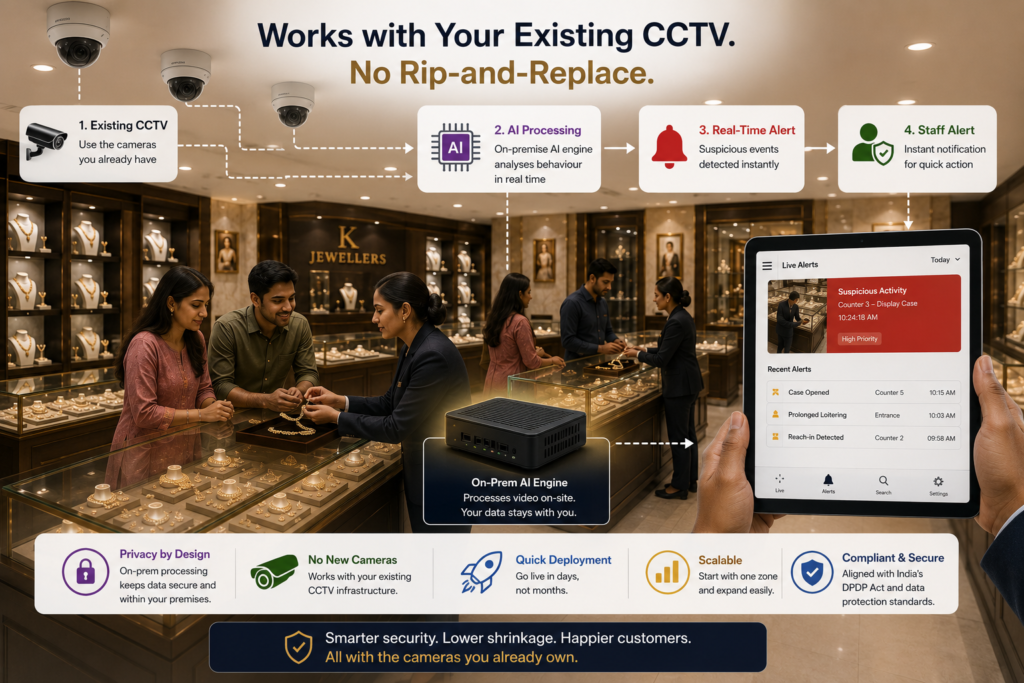
    The biggest myth in jewellery security is that AI means new cameras. It does not. Modern video AI is camera-agnostic and works with the CCTV you already have — the analytics layer sits behind your existing feeds. KenVision is built around exactly this approach: it runs on your current cameras, processes on-prem or at the edge for privacy, and deploys fast so you are not closing the showroom for an integration project. You can explore the broader capability set on our retail analytics solution page.

    A practical rollout usually looks like this: start with the highest-value zone (the diamond or gold display wall), tune the behaviour models to your floor over the first weeks to suppress false alerts, codify the alert SOP with your staff, then extend coverage to billing and entrance zones. Because nothing is being physically replaced, the incremental cost of adding zones is low.

    What to measure

    Treat theft detection like any other operational system and hold it to numbers: alert precision (how many flags are genuine), response time from alert to staff action, shrinkage variance at stock-take versus the prior period, and incident near-misses caught before a loss. Capability claims are easy to make; the showroom that wins is the one that reviews these metrics monthly and keeps tuning.

    Frequently asked questions

    Do I need to replace my existing CCTV cameras?

    No. AI theft detection is camera-agnostic and layers onto the feeds from your current showroom cameras. The analytics engine reads existing video, so there is no rip-and-replace and no extended showroom closure.

    Will customer footage leave my premises?

    With a privacy-first, on-prem or edge deployment, raw footage is processed locally and need not be sent to an external cloud. This supports data-sovereignty expectations and simplifies compliance with India’s DPDP Act.

    Can AI tell a genuine try-on from an actual theft attempt?

    It reasons about behaviour and context — dwell, coordination, case-open and reach-in events — rather than firing on simple motion. This greatly reduces false alarms compared with sensor-only systems, and the models are tuned to your specific floor during onboarding.

    How fast can it be deployed in a working showroom?

    Because it uses existing cameras and processes on-site, deployment is fast and typically starts with your highest-value display zone before extending to billing and entrance areas.

    Does detection alone reduce theft?

    Detection plus a standardised alert SOP is what reduces loss. The alert tells staff something is happening; the SOP ensures every alert gets the same trained, calm response.

    See it on your own floor

    The fastest way to judge whether AI theft detection fits your showroom is to see it run against a real jewellery-retail scenario. Book a 30-minute demo and we will walk through how KenVision works with your existing CCTV, on-prem, with privacy built in.

  • AI Queue Management for Supermarkets in India: Cutting Checkout Abandonment

    For Indian supermarkets, the checkout line is where a good shopping trip quietly turns into lost revenue. Shoppers fill a trolley, then balk at a five-deep queue and either abandon the basket or resolve never to return at peak hours. AI queue management for supermarkets turns the cameras you already run into a live sensor for checkout congestion — detecting queue build-up the moment it starts, alerting floor managers before customers walk out, and giving operations leaders the data to staff lanes to actual demand. This guide explains how it works, what it changes on the floor, and how to deploy it without ripping out a single camera.


    AI queue management: from camera to staffed lane
    Processing stays on-site — no shopper footage leaves the store.

    Why checkout queues quietly cost Indian supermarkets

    Indian grocery retail runs on thin margins and high footfall, and the checkout is the single most common friction point. Long lines at peak hours — evenings, weekends, and the days around salary credit and festivals — push shoppers to abandon full baskets, switch to a competitor across the road, or shift spend to quick-commerce apps. The damage rarely shows up cleanly in a report: a manager sees the day’s sales, not the trolleys left in an aisle. Queue analytics makes that invisible loss visible by measuring how long lines actually are, how long people wait, and how often congestion crosses the point where customers give up.

    The traditional fixes are blunt. Over-staffing every lane all day destroys labour productivity; reacting only when a cashier radios for help is always too late. What store operations needs is an early-warning system tied to real demand — which is exactly what video AI provides.

    How AI queue detection works

    An AI queue management system applies computer-vision models to the live feed from cameras already pointed at the checkout zone. Rather than recording for later review, the models continuously answer operational questions in real time: how many people are waiting at each till, how the queue is growing, and how long the average shopper has stood in line.

    Queue length and wait-time estimation

    The system counts the people grouped at each checkout and tracks the line over time. Because it watches trends, not just snapshots, it can distinguish a brief cluster from a genuine build-up — and estimate wait time from how quickly the line is clearing.

    Threshold-based alerts

    Operators set a simple rule — for example, “more than four people waiting, or an estimated wait over three minutes.” When a lane crosses that threshold, the system pushes an alert to a floor manager’s phone or a back-office dashboard so a new till can be opened before customers abandon their baskets. The threshold is the lever: tighten it for premium formats, loosen it for high-volume value stores.

    Patterns over time

    Beyond live alerts, the same data builds a picture of when congestion repeatedly hits. That history is what lets a chain roster staff to genuine peaks instead of guesswork, and benchmark one store’s checkout experience against another.

    Why KenVision fits Indian supermarket operations

    KenVision is built for the realities of running stores in India, where camera estates are mixed, bandwidth is uneven, and privacy expectations are rising under the DPDP Act.

    • Works with your existing CCTV. There is no rip-and-replace. KenVision is camera-agnostic and layers analytics onto the cameras already covering your checkout lanes, so you protect prior hardware investment.
    • Privacy-first, on-prem and edge processing. Video is analysed on-site at the edge. The output is a count and an alert — not a library of shopper faces leaving the premises — which keeps you aligned with data-minimisation expectations.
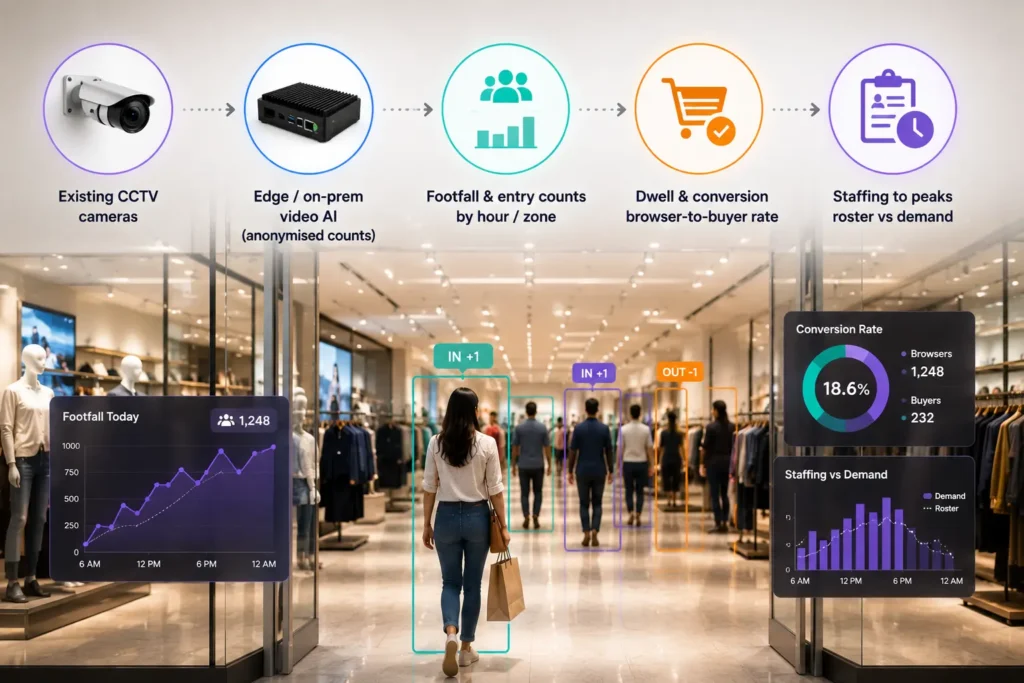
    • Fast to deploy. Because it reuses existing feeds, a pilot can light up in days, not the months a hardware-led project would take.
    • One platform across use cases. The same deployment that watches queues can later cover footfall, dwell, and shrink, so the investment compounds.

    For a broader primer on the technology behind these capabilities, see our overview of AI video analytics, and explore the full retail analytics solution for grocery and supermarket formats.

    Turning queue data into checkout decisions

    The point of measurement is action. In practice, store teams use AI queue management three ways. First, in the moment: alerts trigger a standard response — open a lane, redeploy a packer to bag faster, or route shoppers to a self-checkout bank. Second, in rostering: congestion-by-hour patterns let managers schedule cashiers against the days and time-bands that actually spike, instead of flat all-day cover. Third, at the chain level: comparing queue and wait-time metrics across branches surfaces which stores have a structural checkout problem — too few tills, poor layout, or persistent understaffing — versus a one-off bad day.

    A national grocery operator running this approach can move from anecdote (“the Koramangala store felt slammed on Saturday”) to evidence (“lanes there breach the wait threshold every Saturday 6–8pm, and we are two cashiers short in that band”). That is the difference between reacting and managing.
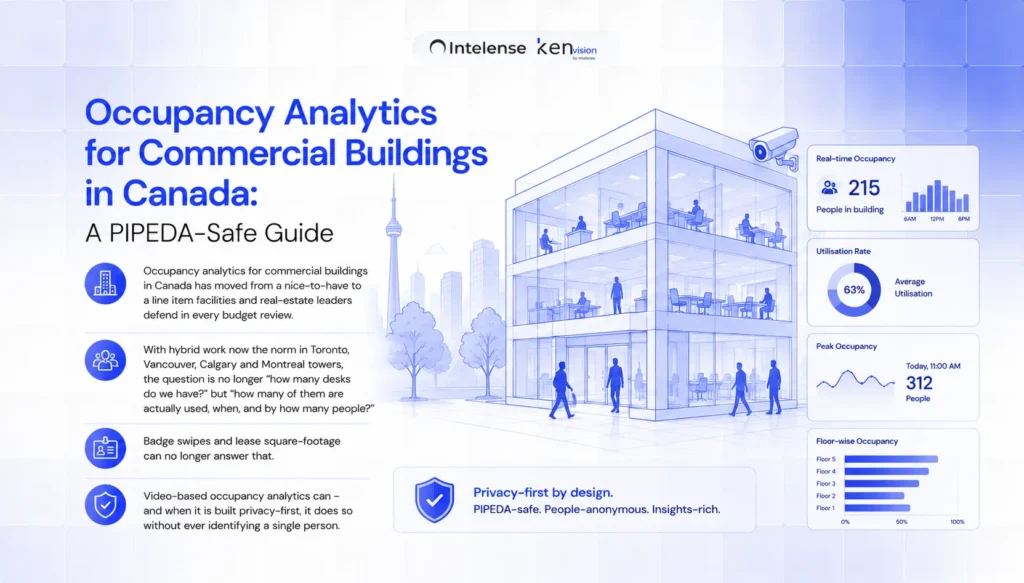
    Deploying without disruption

    A sensible rollout starts with a single high-traffic store. Identify the cameras already viewing the checkout area, confirm their angles capture the queuing space, and define a first threshold based on what the floor team already knows about their peaks. Run it for a few weeks, tune the threshold against real shopper behaviour, and validate that alerts arrive early enough to act on. Once the response loop is working in one store, the same configuration template extends across the estate — and because processing stays on existing infrastructure, scaling is a software exercise, not a procurement cycle.
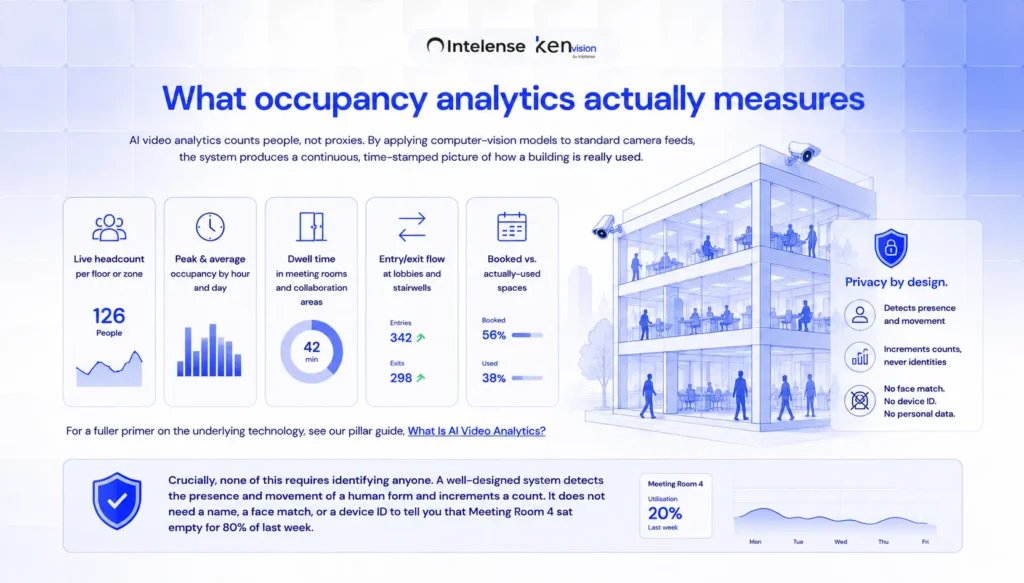
    Conclusion

    Checkout abandonment is one of the most fixable losses in Indian grocery retail, because the trigger — a line that grew too long before anyone acted — is now measurable in real time. AI queue management for supermarkets gives floor teams an early warning, gives schedulers real demand data, and gives leadership a like-for-like view across stores, all on the cameras already installed and with processing kept privately on-site.

    See it on your own store footage. Book a 30-minute KenVision demo and we will show you how queue detection works with your existing CCTV.

    Frequently asked questions

    Do we need to buy new cameras for AI queue management?

    No. KenVision is camera-agnostic and runs on your existing CCTV. As long as a camera already views the checkout queuing area at a usable angle, analytics can be layered on without new hardware.

    Is shopper video sent to the cloud?

    Not by default. KenVision processes feeds on-prem or at the edge, so analysis happens inside the store. The system produces counts and alerts rather than exporting raw shopper footage, which supports privacy-first operation under India’s DPDP Act.

    How quickly can a queue alert reach staff?

    Alerts are generated in real time as the queue crosses your chosen threshold and can be delivered to a manager’s phone or an in-store dashboard within seconds, so a new lane can open before customers abandon their baskets.

    How do we set the right queue threshold?

    Start with what your floor team already knows about peak behaviour — for example four people waiting or a three-minute wait — then tune over the first few weeks against actual abandonment patterns. Premium formats usually run tighter thresholds than high-volume value stores.

    Can we compare checkout performance across multiple stores?

    Yes. Because every store reports the same queue and wait-time metrics, you can benchmark branches against each other to find which have a structural checkout problem versus an occasional bad day.