If you manage office towers, IT parks, or coworking floors in Bengaluru, Mumbai, Gurugram, or Hyderabad, you already have an occupancy number — it just isn’t a reliable one. Badge swipes, Wi-Fi associations, and desk-booking tools each tell a partial story. Occupancy analytics for commercial buildings in India goes beyond badge data by reading what is actually happening in the space: how many people are present, which zones fill up, when peaks hit, and how much of your leased area is genuinely being used. This guide explains how camera-based occupancy analytics works, where badge data falls short, and how facilities teams turn the resulting signal into lower energy bills, smarter leasing decisions, and better workplace experience.
How Camera-Based Occupancy Analytics Works
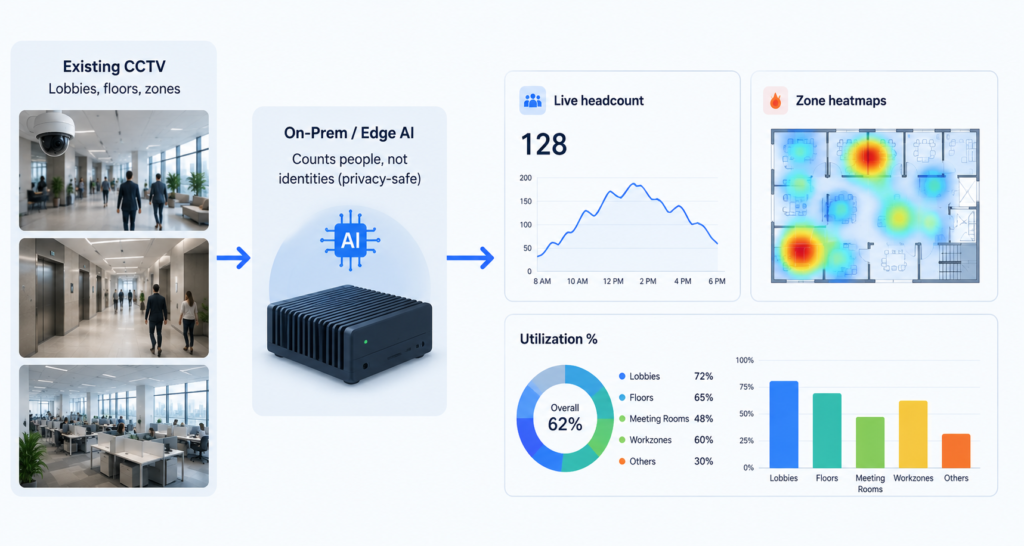
No new cameras. No identity capture. Video processed on site and discarded.
Why Badge Data Falls Short
Access-control badges were designed to answer one question — “is this person allowed through this door?” — and they answer it well. They were never designed to measure occupancy, and in practice they understate it badly. In most Indian commercial buildings, one person badges in and holds the door for three colleagues. Visitors, contractors, housekeeping, and cafeteria staff often move through the building without ever swiping. Tailgating is the norm, not the exception. The result is a headcount that can be off by 30% or more on any given floor.
The other common proxies are no better on their own. Wi-Fi association counts double-count anyone carrying a phone and a laptop, and miss guests on cellular. Desk-booking software tells you what people intended to do, not whether they showed up — a meeting room booked for twelve that seats four is invisible to the calendar. Each source has a blind spot, and stitching them together still leaves you guessing. Occupancy analytics closes the gap by measuring presence directly from the cameras you already have.
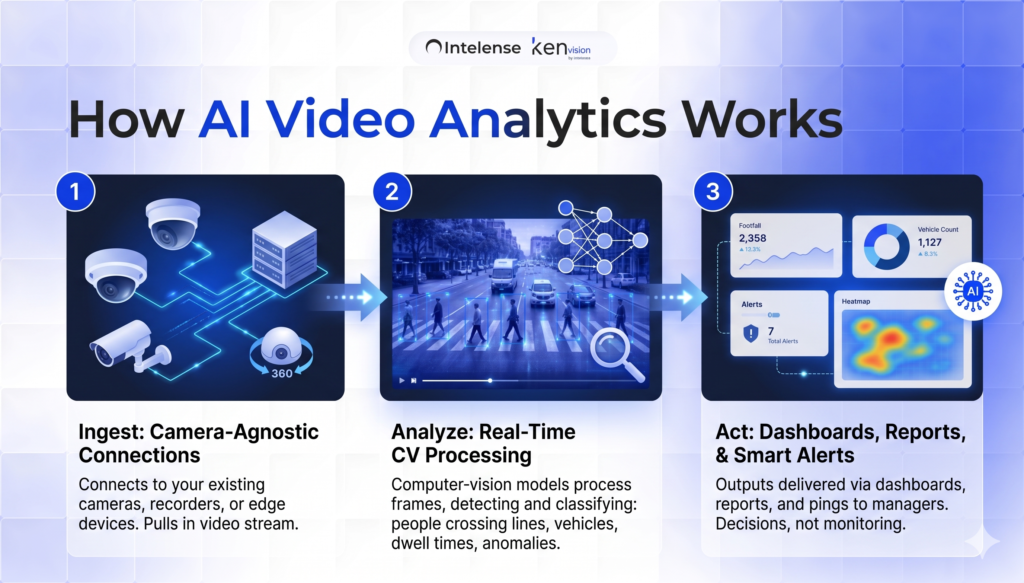
How Camera-Based Occupancy Analytics Works
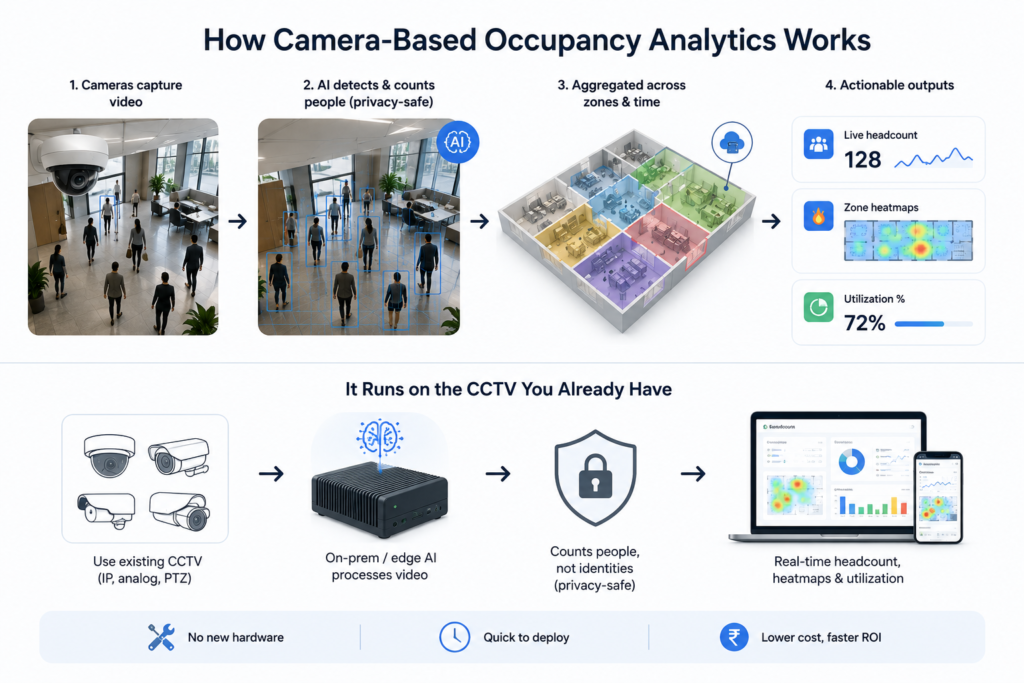
The core idea is simple: computer-vision models detect and count people in a camera’s field of view, then aggregate those counts across zones and time. The system tracks how many people are present in a lobby, an open-plan floor, a cafeteria, or a meeting room, and how long they stay. It distinguishes a corridor that people merely pass through from a collaboration zone where they actually settle, using dwell time. Over days and weeks, this produces the three outputs facilities teams care about: real-time headcount, zone-level heatmaps of where people congregate, and a utilization percentage for every leased area.
Critically, this is a counting task, not a recognition task. Good occupancy analytics counts bodies, not identities — there is no need to know who someone is to know that the third floor is at 80% capacity. That distinction matters enormously for privacy, and it is the foundation of a defensible deployment in India under the Digital Personal Data Protection (DPDP) Act, where minimising the personal data you process is both good practice and good law.
It Runs on the CCTV You Already Have
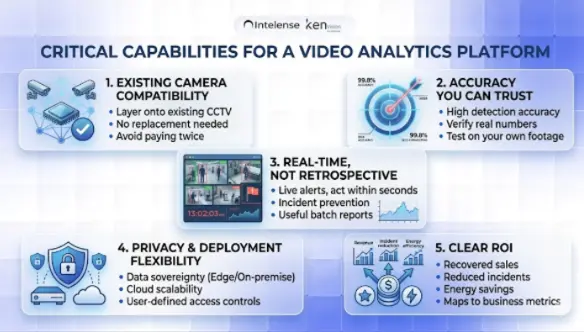
The biggest misconception is that occupancy analytics requires a sensor retrofit — ceiling-mounted people counters at every doorway, thermal arrays in every room. It doesn’t. Modern video AI is camera-agnostic and works with existing CCTV, so the cameras already watching your lobbies, lift bays, and floor plates can do double duty as occupancy sensors. There is no rip-and-replace, no civil work, and no months-long procurement cycle for new hardware. For a facilities team trying to justify a pilot, “use what’s on the ceiling already” is a very different business case from “buy and install a thousand sensors.”
From Signal to Savings: What You Do With It
Cut Energy Use with Occupancy-Aware HVAC and Lighting
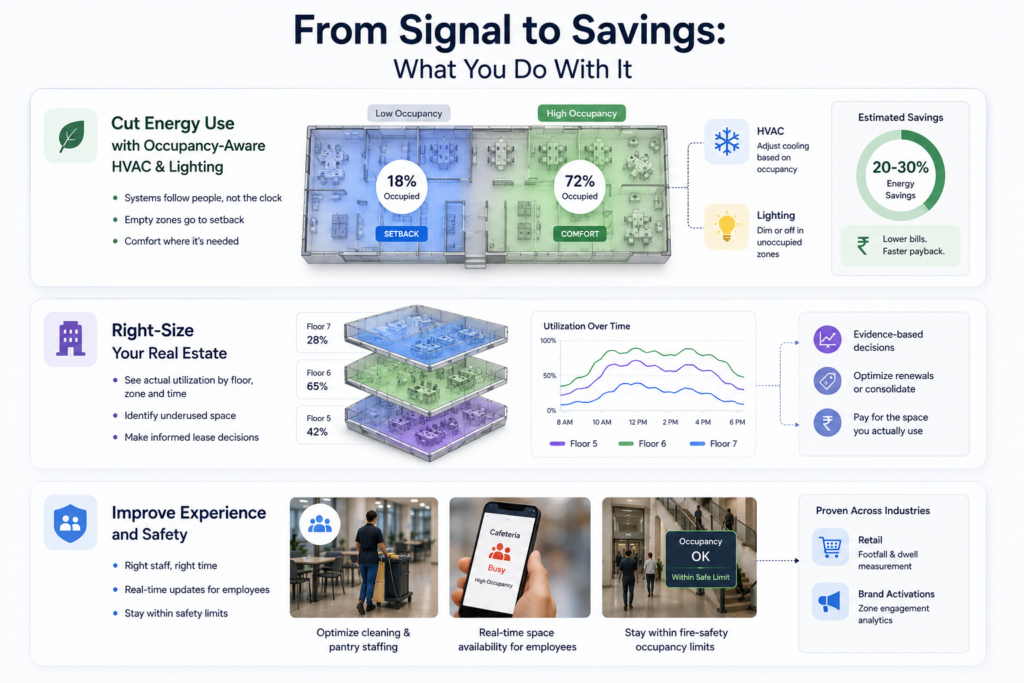
Air-conditioning is the single largest controllable cost in most Indian office buildings, and it is routinely run to a fixed schedule that ignores reality — full cooling for a floor that is 20% occupied on a Friday, or for conference rooms sitting empty all afternoon. Feeding live occupancy data into your building management system lets HVAC and lighting follow people instead of the clock. Zones that are empty get setback; zones that fill up get conditioned before they become uncomfortable. In a climate where cooling loads dominate the bill, occupancy-aware control is one of the fastest paybacks in the building.
Right-Size Your Real Estate
Commercial rent in prime Indian micro-markets is expensive, and hybrid work has left many organisations paying for space they no longer fill. Utilization analytics gives leasing and workplace teams the evidence to act: which floors are chronically under 40% occupied, which neighbourhoods are oversubscribed at 9:30 but dead by 4:00, and whether a consolidation or a sublease is justified. Instead of negotiating a renewal on gut feel, you walk in with weeks of measured utilization per square foot.
Improve Experience and Safety
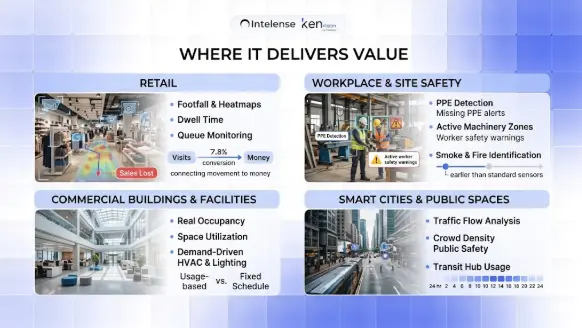
Live headcount also drives the everyday quality of the workplace. Facilities can position cleaning and pantry staff to actual peaks rather than a generic schedule, surface real-time “is the cafeteria packed right now?” signals to employees, and keep occupancy within fire-safety limits in assembly areas. The same generalized capability is already deployed in adjacent sectors — measuring footfall and dwell in retail, and zone engagement at brand activations — which is to say the underlying people-counting technology is mature and field-proven, not experimental.
Doing It the Privacy-First Way in India
Occupancy analytics touches a building full of employees and visitors, so the deployment model matters as much as the accuracy. A privacy-first architecture processes video on-premises or at the edge, inside your own network, and converts each frame into anonymous counts rather than storing or transmitting identifiable footage. Nothing about a named individual needs to leave the building. This aligns directly with the DPDP Act’s principles of purpose limitation and data minimisation: you are measuring occupancy, not surveilling people, and the system is built so that it cannot do the latter even if asked.
On-prem and edge processing has a practical benefit too — it keeps bandwidth and cloud costs down, and it works even where connectivity to a head office or a foreign cloud region is unreliable or undesirable for compliance reasons. For multinational tenants operating in both India and markets like Canada, the same on-prem model satisfies the stricter of the two regimes by default. (For a deeper comparison, see our guide on regional analytics practice across markets.)
Getting Started
The fastest path to value is a focused pilot: pick one or two floors with existing cameras, run occupancy analytics for a few weeks, and compare the measured utilization against what your badge and booking data claimed. Almost every team is surprised by the gap. From there, the obvious next steps are wiring the live signal into your BMS for occupancy-aware HVAC and building a utilization dashboard for the leasing conversation. Because the cameras and the network are already in place, deployment is measured in days, not quarters.
To understand the broader category and where occupancy fits alongside footfall, queue, and safety use cases, start with our pillar guide, What Is AI Video Analytics?, and explore the full commercial buildings solution from KenVision.
Ready to see your real occupancy numbers? Book a 30-minute KenVision demo and we’ll show you how to turn your existing CCTV into a privacy-safe occupancy sensor — no new hardware required.
Frequently Asked Questions
How accurate is camera-based occupancy analytics compared to badge data?
Because it counts people directly in each zone rather than inferring presence from door swipes, camera-based occupancy analytics avoids the tailgating, visitor, and held-door errors that make badge counts unreliable. It measures who is actually in a space, including people who never badge in.
Do we need to install new sensors or cameras?
No. The technology is camera-agnostic and works with your existing CCTV. The cameras already covering lobbies, floors, and common areas can be used as occupancy sensors, so there’s no rip-and-replace and no civil work.
Is occupancy analytics compliant with India’s DPDP Act?
A privacy-first deployment processes video on-premises or at the edge and produces anonymous counts rather than identifying individuals, aligning with the DPDP Act’s data-minimisation and purpose-limitation principles. Footage need not leave your building, and no personal identity data is required to measure occupancy. This is general information, not legal advice — confirm specifics with your compliance team.
How does occupancy data reduce energy costs?
Feeding live occupancy into your building management system lets HVAC and lighting respond to actual presence — setting back empty zones and conditioning busy ones — instead of running to a fixed schedule. In cooling-dominated Indian climates, this is one of the fastest-payback uses of the data.
How long does a deployment take?
Because it runs on existing cameras and on-prem or edge hardware, a focused pilot on one or two floors can be live in days rather than the months a sensor retrofit would require.