Blog

  • Occupancy Analytics for Commercial Buildings in India: Beyond Badge Data

    If you manage office towers, IT parks, or coworking floors in Bengaluru, Mumbai, Gurugram, or Hyderabad, you already have an occupancy number — it just isn’t a reliable one. Badge swipes, Wi-Fi associations, and desk-booking tools each tell a partial story. Occupancy analytics for commercial buildings in India goes beyond badge data by reading what is actually happening in the space: how many people are present, which zones fill up, when peaks hit, and how much of your leased area is genuinely being used. This guide explains how camera-based occupancy analytics works, where badge data falls short, and how facilities teams turn the resulting signal into lower energy bills, smarter leasing decisions, and better workplace experience.


    How Camera-Based Occupancy Analytics Works

    No new cameras. No identity capture. Video processed on site and discarded.

    Why Badge Data Falls Short

    Access-control badges were designed to answer one question — “is this person allowed through this door?” — and they answer it well. They were never designed to measure occupancy, and in practice they understate it badly. In most Indian commercial buildings, one person badges in and holds the door for three colleagues. Visitors, contractors, housekeeping, and cafeteria staff often move through the building without ever swiping. Tailgating is the norm, not the exception. The result is a headcount that can be off by 30% or more on any given floor.

    The other common proxies are no better on their own. Wi-Fi association counts double-count anyone carrying a phone and a laptop, and miss guests on cellular. Desk-booking software tells you what people intended to do, not whether they showed up — a meeting room booked for twelve that seats four is invisible to the calendar. Each source has a blind spot, and stitching them together still leaves you guessing. Occupancy analytics closes the gap by measuring presence directly from the cameras you already have.

    How Camera-Based Occupancy Analytics Works
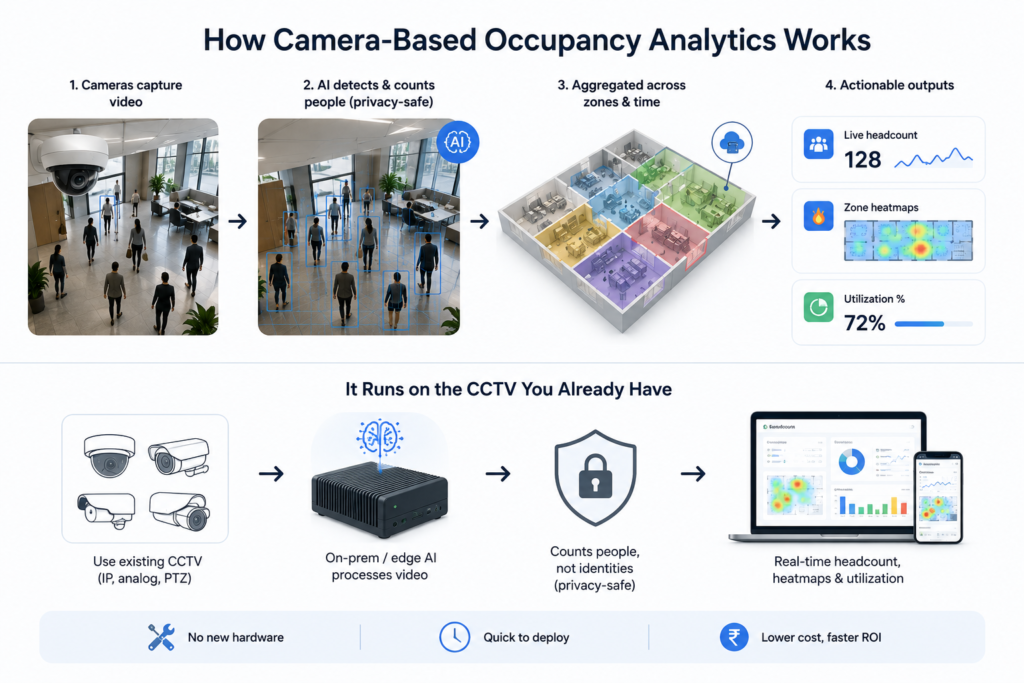
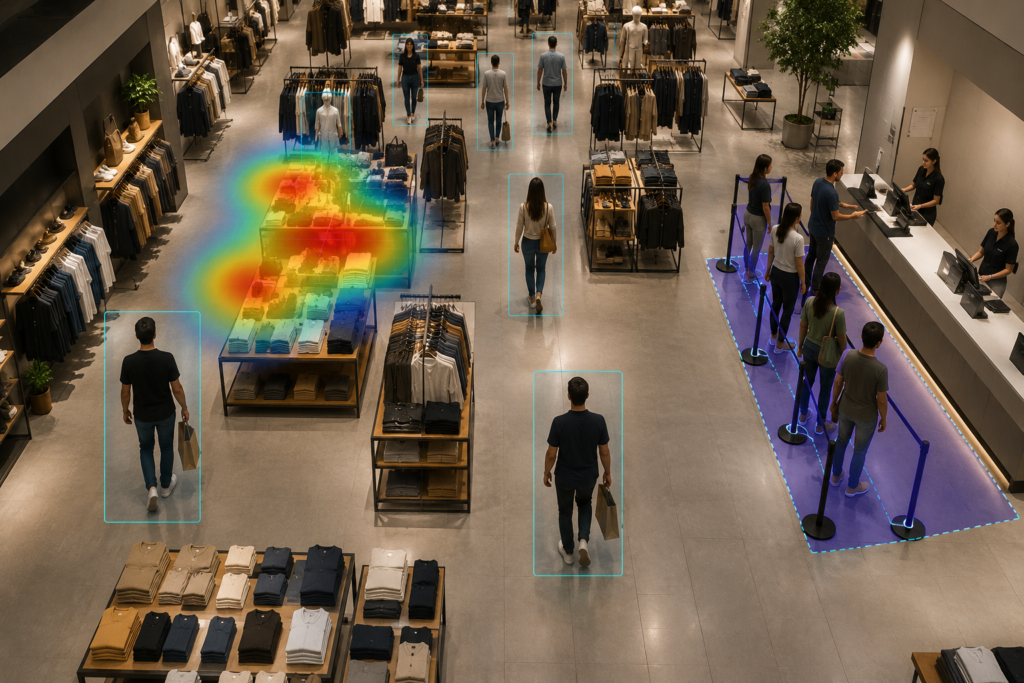
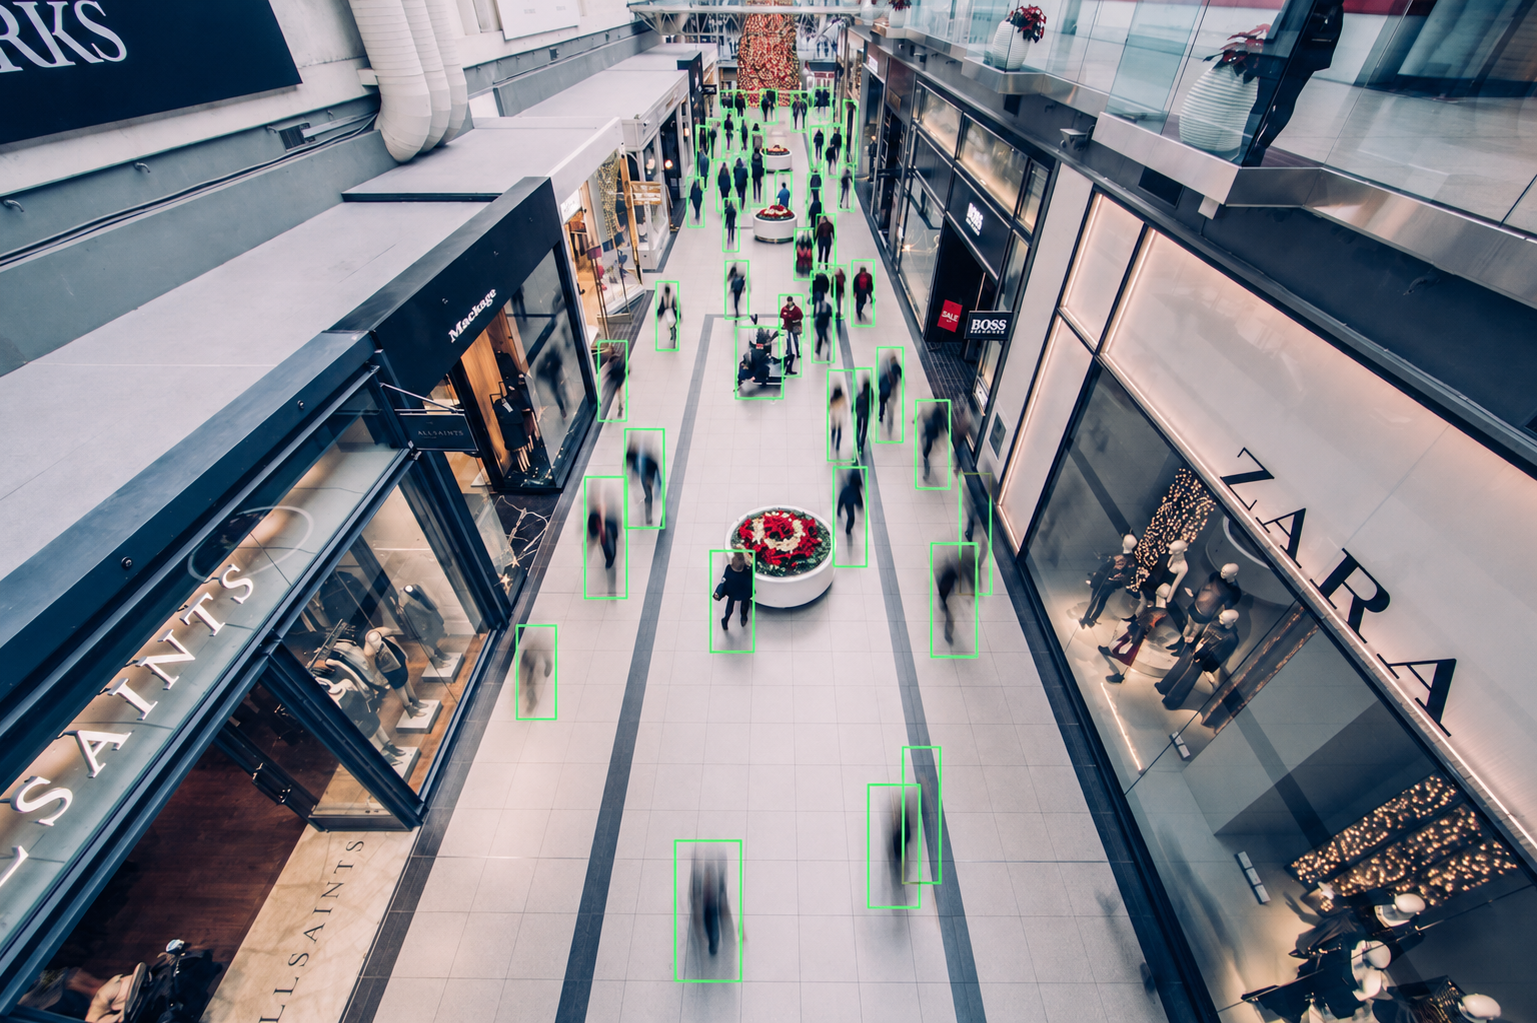
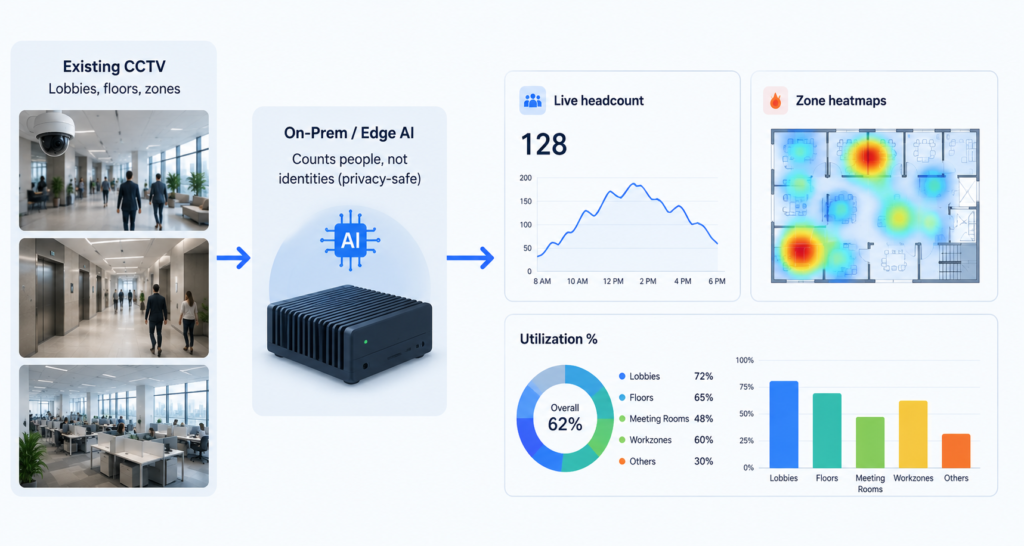
    The core idea is simple: computer-vision models detect and count people in a camera’s field of view, then aggregate those counts across zones and time. The system tracks how many people are present in a lobby, an open-plan floor, a cafeteria, or a meeting room, and how long they stay. It distinguishes a corridor that people merely pass through from a collaboration zone where they actually settle, using dwell time. Over days and weeks, this produces the three outputs facilities teams care about: real-time headcount, zone-level heatmaps of where people congregate, and a utilization percentage for every leased area.

    Critically, this is a counting task, not a recognition task. Good occupancy analytics counts bodies, not identities — there is no need to know who someone is to know that the third floor is at 80% capacity. That distinction matters enormously for privacy, and it is the foundation of a defensible deployment in India under the Digital Personal Data Protection (DPDP) Act, where minimising the personal data you process is both good practice and good law.

    It Runs on the CCTV You Already Have

    The biggest misconception is that occupancy analytics requires a sensor retrofit — ceiling-mounted people counters at every doorway, thermal arrays in every room. It doesn’t. Modern video AI is camera-agnostic and works with existing CCTV, so the cameras already watching your lobbies, lift bays, and floor plates can do double duty as occupancy sensors. There is no rip-and-replace, no civil work, and no months-long procurement cycle for new hardware. For a facilities team trying to justify a pilot, “use what’s on the ceiling already” is a very different business case from “buy and install a thousand sensors.”

    From Signal to Savings: What You Do With It

    Cut Energy Use with Occupancy-Aware HVAC and Lighting
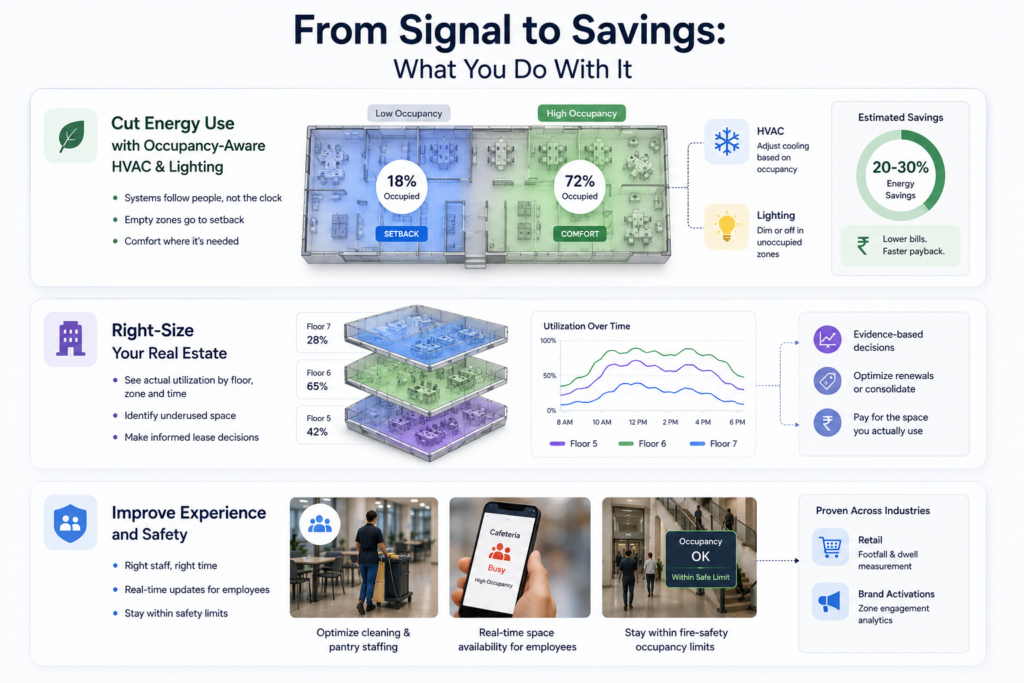
    Air-conditioning is the single largest controllable cost in most Indian office buildings, and it is routinely run to a fixed schedule that ignores reality — full cooling for a floor that is 20% occupied on a Friday, or for conference rooms sitting empty all afternoon. Feeding live occupancy data into your building management system lets HVAC and lighting follow people instead of the clock. Zones that are empty get setback; zones that fill up get conditioned before they become uncomfortable. In a climate where cooling loads dominate the bill, occupancy-aware control is one of the fastest paybacks in the building.

    Right-Size Your Real Estate

    Commercial rent in prime Indian micro-markets is expensive, and hybrid work has left many organisations paying for space they no longer fill. Utilization analytics gives leasing and workplace teams the evidence to act: which floors are chronically under 40% occupied, which neighbourhoods are oversubscribed at 9:30 but dead by 4:00, and whether a consolidation or a sublease is justified. Instead of negotiating a renewal on gut feel, you walk in with weeks of measured utilization per square foot.

    Improve Experience and Safety

    Live headcount also drives the everyday quality of the workplace. Facilities can position cleaning and pantry staff to actual peaks rather than a generic schedule, surface real-time “is the cafeteria packed right now?” signals to employees, and keep occupancy within fire-safety limits in assembly areas. The same generalized capability is already deployed in adjacent sectors — measuring footfall and dwell in retail, and zone engagement at brand activations — which is to say the underlying people-counting technology is mature and field-proven, not experimental.

    Doing It the Privacy-First Way in India

    Occupancy analytics touches a building full of employees and visitors, so the deployment model matters as much as the accuracy. A privacy-first architecture processes video on-premises or at the edge, inside your own network, and converts each frame into anonymous counts rather than storing or transmitting identifiable footage. Nothing about a named individual needs to leave the building. This aligns directly with the DPDP Act’s principles of purpose limitation and data minimisation: you are measuring occupancy, not surveilling people, and the system is built so that it cannot do the latter even if asked.

    On-prem and edge processing has a practical benefit too — it keeps bandwidth and cloud costs down, and it works even where connectivity to a head office or a foreign cloud region is unreliable or undesirable for compliance reasons. For multinational tenants operating in both India and markets like Canada, the same on-prem model satisfies the stricter of the two regimes by default. (For a deeper comparison, see our guide on regional analytics practice across markets.)

    Getting Started

    The fastest path to value is a focused pilot: pick one or two floors with existing cameras, run occupancy analytics for a few weeks, and compare the measured utilization against what your badge and booking data claimed. Almost every team is surprised by the gap. From there, the obvious next steps are wiring the live signal into your BMS for occupancy-aware HVAC and building a utilization dashboard for the leasing conversation. Because the cameras and the network are already in place, deployment is measured in days, not quarters.

    To understand the broader category and where occupancy fits alongside footfall, queue, and safety use cases, start with our pillar guide, What Is AI Video Analytics?, and explore the full commercial buildings solution from KenVision.

    Ready to see your real occupancy numbers? Book a 30-minute KenVision demo and we’ll show you how to turn your existing CCTV into a privacy-safe occupancy sensor — no new hardware required.

    Frequently Asked Questions

    How accurate is camera-based occupancy analytics compared to badge data?

    Because it counts people directly in each zone rather than inferring presence from door swipes, camera-based occupancy analytics avoids the tailgating, visitor, and held-door errors that make badge counts unreliable. It measures who is actually in a space, including people who never badge in.

    Do we need to install new sensors or cameras?

    No. The technology is camera-agnostic and works with your existing CCTV. The cameras already covering lobbies, floors, and common areas can be used as occupancy sensors, so there’s no rip-and-replace and no civil work.

    Is occupancy analytics compliant with India’s DPDP Act?

    A privacy-first deployment processes video on-premises or at the edge and produces anonymous counts rather than identifying individuals, aligning with the DPDP Act’s data-minimisation and purpose-limitation principles. Footage need not leave your building, and no personal identity data is required to measure occupancy. This is general information, not legal advice — confirm specifics with your compliance team.

    How does occupancy data reduce energy costs?

    Feeding live occupancy into your building management system lets HVAC and lighting respond to actual presence — setting back empty zones and conditioning busy ones — instead of running to a fixed schedule. In cooling-dominated Indian climates, this is one of the fastest-payback uses of the data.

    How long does a deployment take?

    Because it runs on existing cameras and on-prem or edge hardware, a focused pilot on one or two floors can be live in days rather than the months a sensor retrofit would require.
  • What Is AI Video Analytics? A 2026 Guide for Operations Leaders

    AI video analytics is software that turns ordinary camera feeds into structured, real-time data, counting people, detecting events, and surfacing patterns that a human watching a wall of monitors would never catch.

    For operations leaders in 2026, it has quietly become one of the highest-leverage ways to understand what is actually happening across stores, buildings, worksites, and public spaces.

    Instead of treating cameras as a passive record you only review after something goes wrong, AI video analytics makes them an always-on sensor network that feeds your dashboards, alerts, and decisions.

    This guide explains what the technology is, how it works, where it delivers measurable value, and what to look for when you evaluate a platform.

    It is written for the people who own the outcomes — retail ops, facilities, security, and brand teams — not for data scientists.

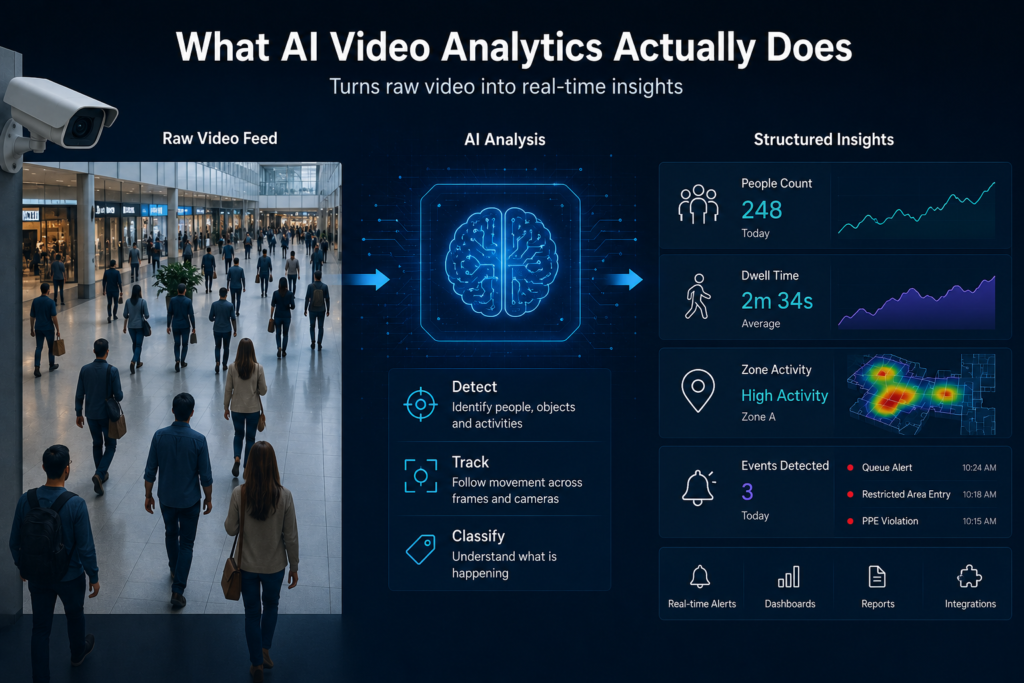
    What AI video analytics actually does

    At its core, AI video analytics applies computer-vision models to a video stream and converts what the camera sees into numbers and events.

    A traditional camera produces footage. An analytics layer produces answers: how many people entered between 4 and 6 p.m., which aisle held attention the longest, whether a worker stepped into a restricted zone, or whether a queue has grown past four people.

    The footage is still there, but the value shifts from “evidence after the fact” to “insight in the moment.”

    Three capabilities sit underneath almost every use case: detection (finding objects and people in a frame), tracking (following them across frames and cameras), and classification (labelling what is happening — a person, a vehicle, a fall, smoke, a PPE violation).

    Layered on top are counting, dwell-time measurement, zone and line-crossing logic, and anomaly detection.

    Modern systems run many of these models simultaneously on the same feed.

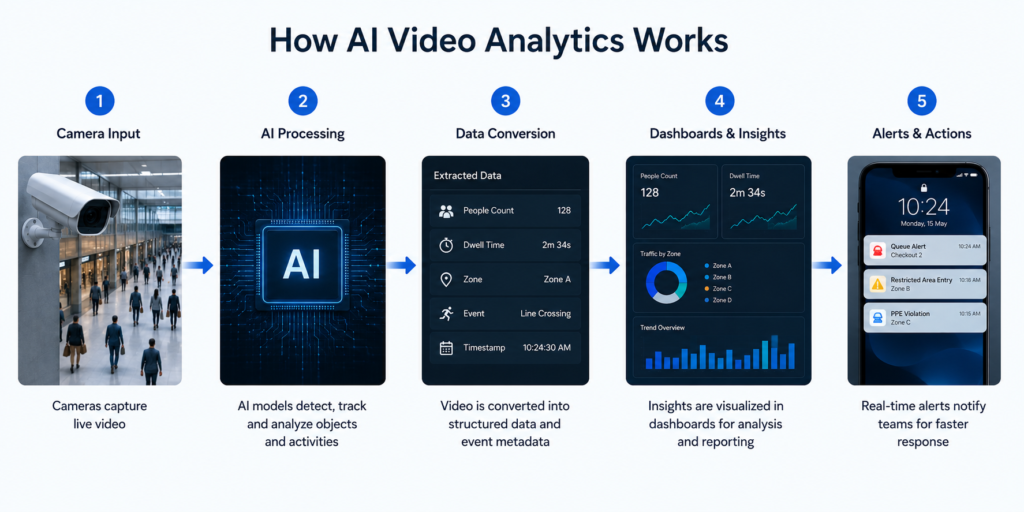
    How it works, step by step

    The pipeline is consistent across vendors even when the underlying models differ.

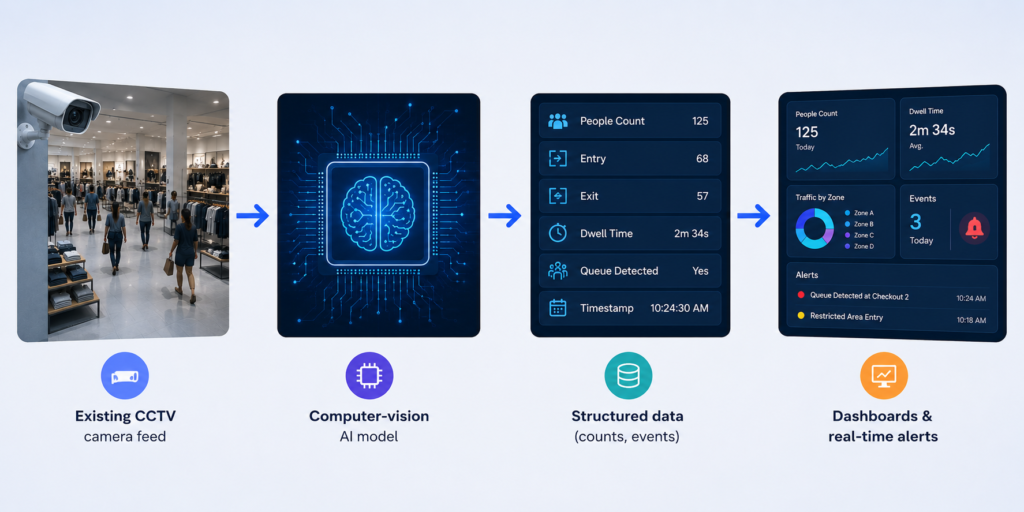
    A camera streams video into a processing engine — either a small edge device near the camera or a server on-premises. Computer-vision models analyse each frame, identifying and tracking objects.

    That output becomes structured data: counts, timestamps, zones, and event flags. Finally, the data flows into dashboards for trend analysis and into an alerting layer for anything that needs immediate attention.

    The detail that matters most to operations leaders is where the processing happens.

    Edge and on-premises processing means the video is analysed locally and often only the resulting metadata leaves the camera — not the raw footage.

    That is faster, cheaper on bandwidth, and far easier to defend from a privacy standpoint. We go deeper on this in our guide to edge vs. cloud vs. hybrid video AI.

    Where AI video analytics delivers value

    The technology is sector-agnostic, but the wins are concrete. A few patterns we see across live deployments:

    Retail. Footfall counting, store heatmaps, dwell-time-to-conversion analysis, and queue detection turn a store’s cameras into a continuous merchandising and staffing instrument. A national electronics retailer, for example, can measure engagement at demo zones to convert browsers into buyers and align staff to traffic peaks. See how this maps to outcomes on our retail analytics solution page.

    High-value retail and security – A jewellery chain can use suspicious-behaviour detection and standardized alert-response SOPs around display cases — moving beyond the panic button to proactive prevention. The same building blocks power video surveillance and safety use cases like PPE detection, fire and smoke detection, and perimeter monitoring.

    Brand activations – A leading FMCG brand running product sampling across mobile and pop-up counters can measure engagement and get a privacy-safe, anonymized demographic breakdown of who interacted — without storing identities. That converts a previously unmeasured spend into a campaign you can optimize.

    Buildings and cities – Occupancy analytics inform HVAC and space-utilization decisions, while traffic-flow and crowd-density monitoring support public safety. The common thread is the same: existing cameras, turned into operational data.

    Why “works with existing CCTV” changes the math

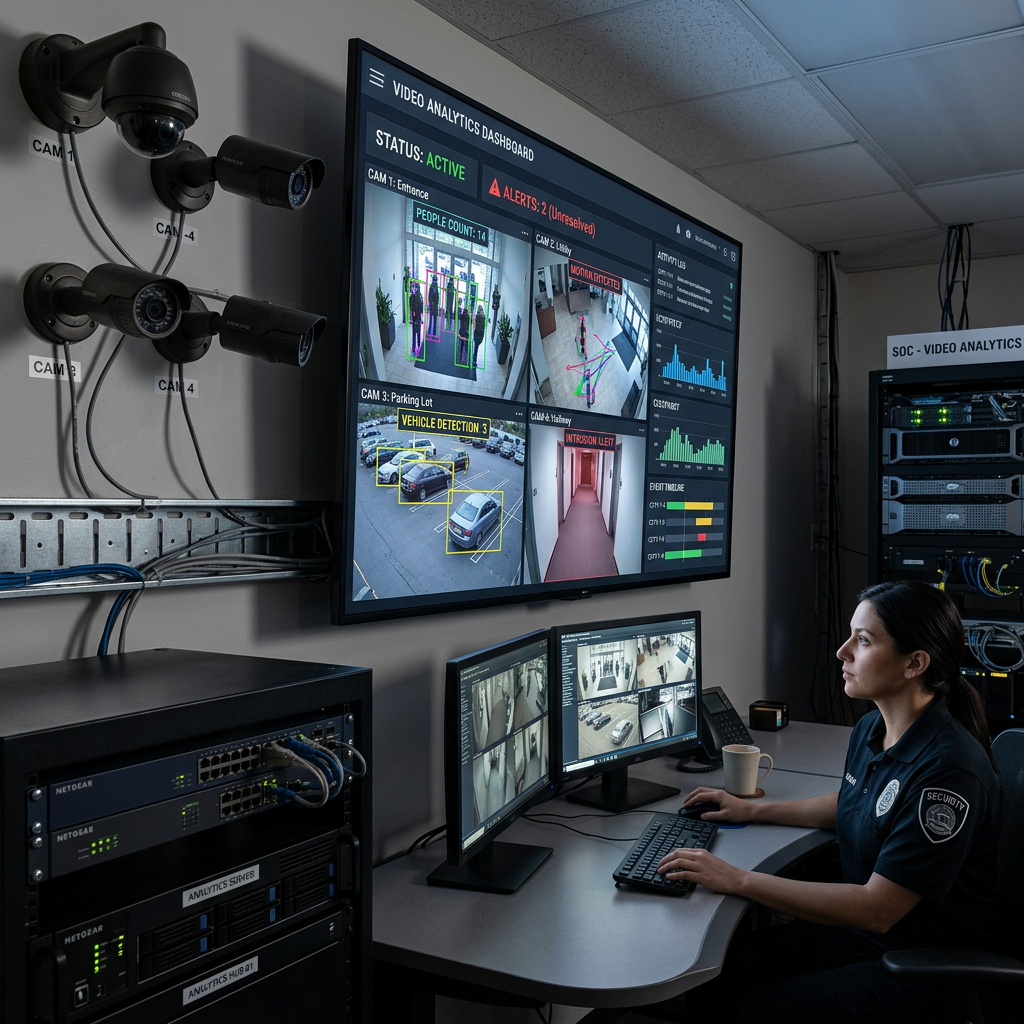
    Security officer watching multiple live video surveillance feeds on screens showing people, vehicle detection, and alerts
    A security officer monitors live video analytics in a control room with multiple surveillance feeds.

    The single biggest misconception is that AI video analytics requires new, specialized cameras.

    The strongest modern platforms are camera-agnostic and retrofit onto the CCTV you already own — no rip-and-replace.

    That collapses both the cost and the timeline of getting started, because the capital expense is already on the floor.

    Deployment becomes a software exercise measured in days, not a hardware project measured in quarters.

    If you are evaluating this path, our practical guide to retrofitting AI onto existing CCTV cameras walks through the steps.

    Privacy is a design choice, not an afterthought

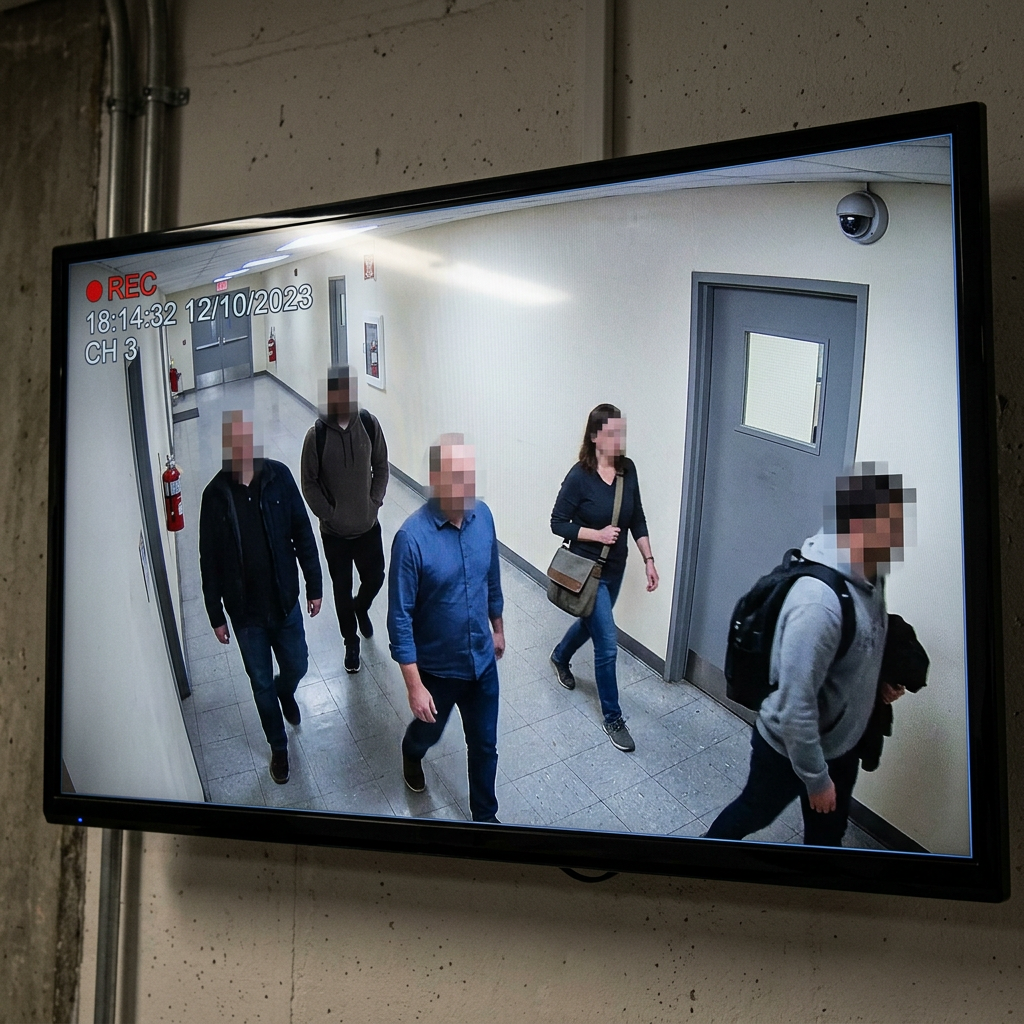
    Five individuals walking in a corridor monitored by a security camera on December 10, 2023
    Security camera footage shows five people walking down a hallway.

    Because the technology observes people, privacy has to be engineered in.

    The privacy-first approach is to process video on-premises or at the edge, extract only the metadata you need (a count, a dwell time, an anonymized age/gender bucket), and never export raw footage or biometric identities to the cloud.

    Done this way, you get the operational insight while keeping data inside your own walls — which also simplifies compliance with regimes like India’s DPDP Act and Canada’s PIPEDA.

    The architecture choice and the compliance outcome are the same decision.

    What to look for in a 2026 platform

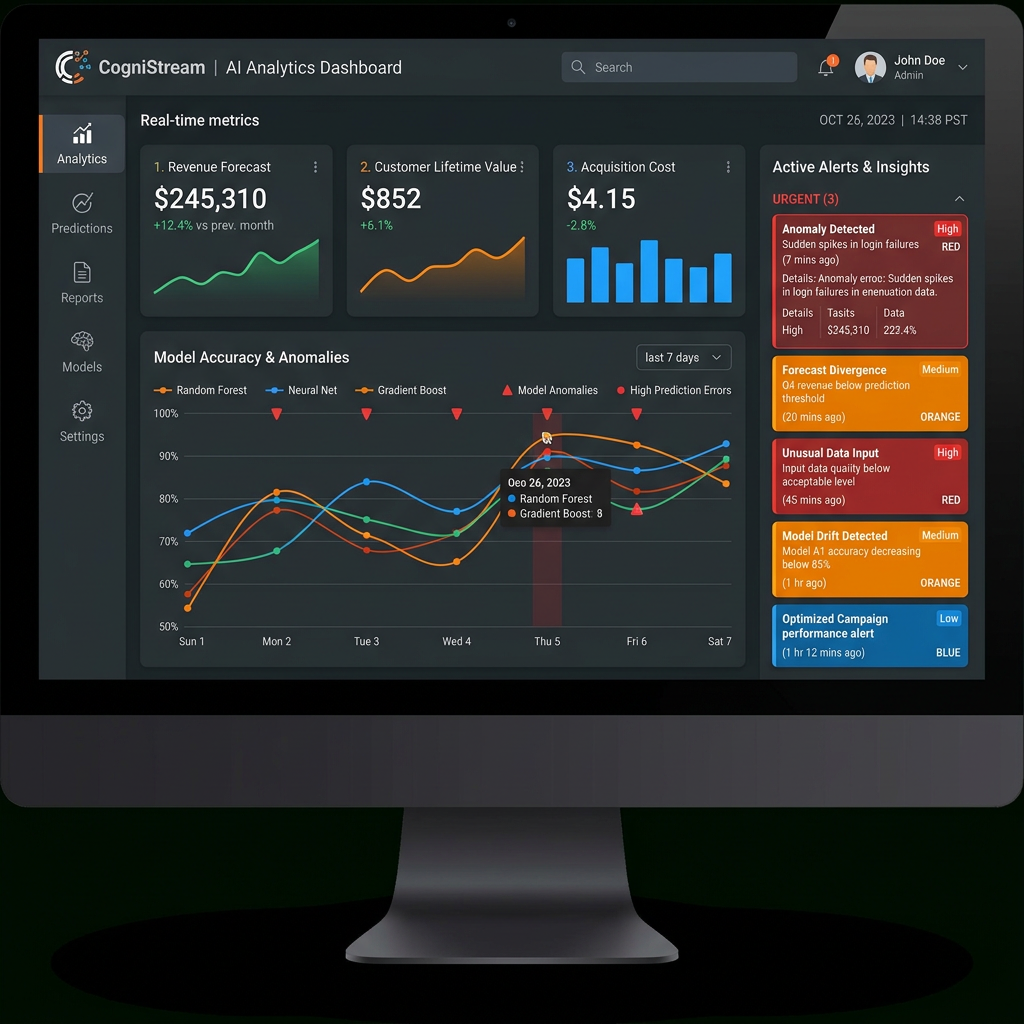
    AI analytics dashboard displaying revenue forecast, customer lifetime value, acquisition cost, model accuracy, and active alerts
    Real-time AI analytics dashboard showing metrics, model accuracy, and alerts

    When you evaluate AI video analytics, weigh five things: whether it works with your existing cameras; whether it offers on-prem and edge processing for privacy and speed; how fast it deploys; whether it is camera-agnostic across your mixed hardware estate; and whether the analytics map to decisions you actually make rather than vanity metrics.

    A footfall number is only useful if it changes a staffing roster; a heatmap only matters if it moves a display. The best platforms close that loop.

    Getting started

    You do not need a moonshot to begin. Pick one location and one question — “are we losing sales to checkout queues?” or “which demo zone earns the most attention?” — point your existing cameras at it, and let the data settle for a few weeks.

    The clarity of a single well-measured question is usually enough to build the case for rolling out across the estate.

    If you would like to see what your own cameras could tell you, book a 30-minute KenVision demo and we will walk through your specific use case.

    Frequently asked questions

    Is AI video analytics the same as facial recognition?

    No. Most operational analytics — counting, dwell time, queue detection, occupancy — require no identification of individuals at all. A privacy-first platform measures behaviour and patterns anonymously and never builds a biometric identity profile.

    Do I need to replace my existing CCTV cameras?

    Generally not. Camera-agnostic platforms retrofit onto the cameras you already have, which is why deployment can take days rather than a hardware-replacement project of several months.

    Does the video have to go to the cloud?

    No. With edge or on-premises processing, video is analysed locally and typically only anonymized metadata leaves the site. This is faster, uses less bandwidth, and keeps sensitive footage inside your own infrastructure.

    What kinds of results can operations teams expect?

    Outcomes are use-case specific, but the common thread is converting previously invisible activity — footfall patterns, dwell time, queue build-up, safety violations — into data that informs staffing, merchandising, energy, and security decisions in near real time.

    How quickly can we deploy AI video analytics?

    Because it works with existing cameras and runs as a software layer, a focused single-site pilot can typically be stood up in days, with insights accumulating over the following weeks.

  • Retail Footfall Analytics in Canada: A 2026 Guide for Store Operators

    Retail footfall analytics in Canada has moved from a nice-to-have to a baseline operating tool.

    Rising occupancy costs, tighter labour budgets, and shoppers who research online before they walk in mean Canadian store operators can no longer run on POS data alone.

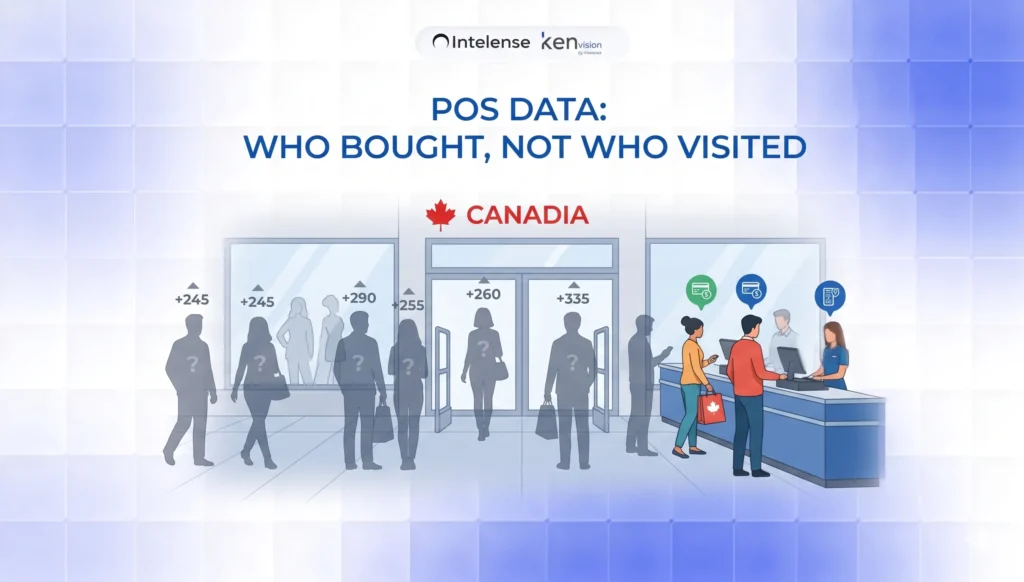
    Point-of-sale tells you who bought; it says nothing about the far larger group who walked in, looked, and left.

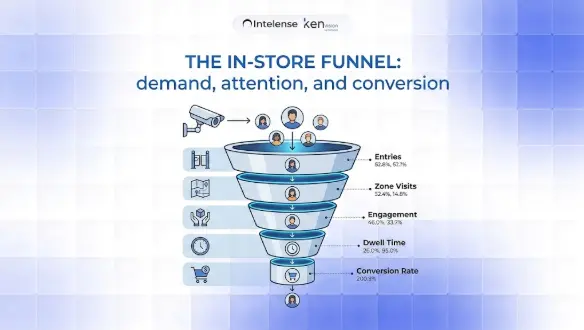
    Footfall analytics closes that gap by turning the cameras you already have into a continuous counter of demand, attention, and conversion.

    This guide explains how retail footfall analytics works in a Canadian context, what to measure, how to stay onside of privacy law, and how to get value from the CCTV already mounted in your ceilings.

    For the broader category, see our pillar overview, What Is AI Video Analytics?

    What retail footfall analytics actually measures

    At its simplest, footfall analytics counts how many people enter a store and when. Modern computer-vision systems go much further, distinguishing staff from shoppers, separating entries from exits, filtering out re-entries, and segmenting traffic by entrance. Layered on top of raw counts are the metrics that drive decisions:

    • Conversion rate — transactions divided by visitors, the single most important number most Canadian retailers still do not track in real time.
    • Dwell and zone engagement — how long shoppers linger in departments or in front of specific displays.
    • Peak-hour curves — the hourly and day-of-week rhythm that should drive staff scheduling.
    • Capture rate — for mall and high-street stores, the share of passing traffic that comes inside.

    Anonymous, privacy-safe demographic estimates (broad age band and gender) can also be derived to understand who a category attracts, without ever identifying an individual. Together these turn a store from a black box into a measurable funnel.

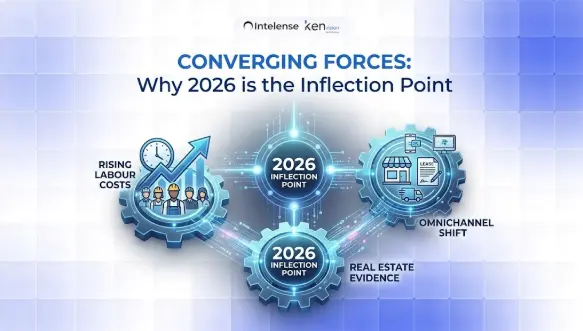
    Why 2026 is the inflection point for Canadian retail

    Three forces are converging.

    • First, labour: with minimum wages rising across provinces, every scheduled hour has to be justified, and aligning staff to actual traffic peaks is one of the fastest ways to protect both service and margin.
    • Second, real estate: landlords and head offices increasingly want evidence of foot traffic and capture rate to negotiate rent and justify locations.
    • Third, omnichannel: as more purchase research happens online, the in-store job shifts to conversion and experience — which you cannot improve if you cannot measure it.

    Privacy-first by design: PIPEDA and provincial rules

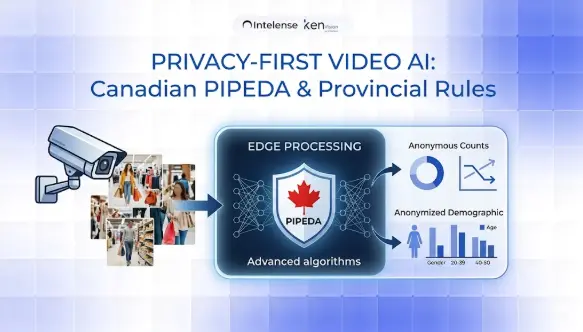
    Canadian retailers operate under the federal Personal Information Protection and Electronic Documents Act (PIPEDA), and in some provinces under substantially similar laws such as Quebec’s private-sector regime (including Law 25), British Columbia’s PIPA, and Alberta’s PIPA.

    The throughline is consent, purpose limitation, and data minimization.

    The good news for footfall analytics is that well-designed systems are inherently privacy-respecting: they convert video into anonymous counts and trajectories and discard or never store identifying imagery.

    The practical implications for a compliant deployment are straightforward.

    Process video on-premise or at the edge so raw footage never leaves the store.

    Output statistics — counts, dwell times, anonymized demographic bands — rather than face templates or identities. Post clear notice that analytics is in use, as you already do for security cameras.

    KenVision is built around exactly this model: processing can run on local or edge hardware so personal data stays inside your four walls, which makes the data-sovereignty conversation with a Canadian privacy officer far simpler.

    You can read more on the approach in our overview of privacy-first video AI.

    You do not need new cameras

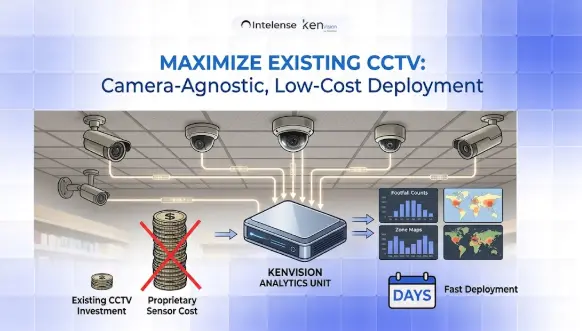
    The most common objection — “we would have to rip out our CCTV” — is usually wrong. Footfall analytics can run on the existing IP cameras most Canadian stores already have, provided they offer a reasonable view of entrances and key zones.

    A camera-agnostic, software-led approach means the analytics layer ingests existing feeds rather than demanding a proprietary sensor at every door.

    That keeps capital cost low, shortens deployment to days rather than months, and avoids the disruption of construction in a live store.

    Where coverage gaps exist — a poorly angled entrance camera, say — you add a single device rather than re-cabling the building.

    From counts to action: what good operators do

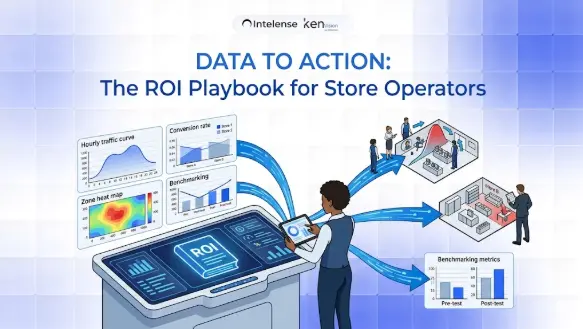
    Numbers only matter if they change behaviour. The retailers getting return from footfall analytics tend to run the same playbook.

    They schedule staff to traffic curves, not to habit, so the busiest 90 minutes are never under-covered.

    They set and watch conversion rate by store and by daypart, then investigate outliers — a store with high traffic and low conversion is usually a staffing, layout, or stock problem you can fix.

    They test layout and display changes as genuine experiments, comparing dwell and conversion before and after.

    And for chains, they benchmark locations against each other to spread what works. For a deeper toolkit by use case, see our retail analytics solutions.

    What this looks like in the field

    Real deployments show the range. A national electronics retailer used demo-zone engagement and footfall data to see where browsers clustered and to move staff toward those peaks, converting more lookers into buyers.

    A jewellery chain combined footfall context with suspicious-behaviour alerting around high-value display cases, standardizing how teams respond.

    A leading FMCG brand measured sampling-counter performance across mobile and pop-up locations, including an anonymized age-and-gender read of who engaged.

    The common thread is that the camera infrastructure was already there; analytics simply made it legible.

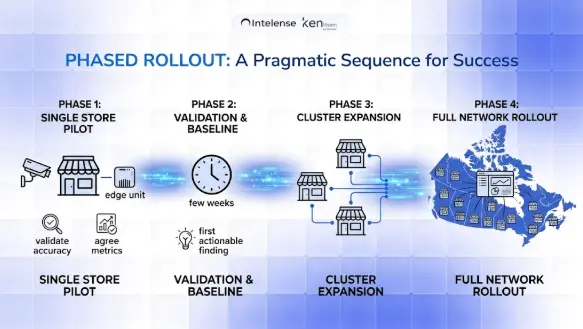
    A pragmatic rollout sequence

    Start with a single store or a small cluster.

    Confirm camera placement at entrances and two or three priority zones.

    Stand up edge processing, validate counting accuracy against a manual spot-count, and agree the two or three metrics leadership will actually look at — usually footfall, conversion, and peak coverage. Run for a few weeks, act on the first obvious finding (almost always a staffing-to-traffic mismatch), and only then expand.

    This keeps the project honest and the ROI visible before you scale across the network.

    Conclusion

    For Canadian store operators, retail footfall analytics in 2026 is the most accessible lever for improving conversion, right-sizing labour, and defending real-estate decisions — and it can be done in a privacy-first, PIPEDA-aligned way on the cameras you already own.

    The barrier is no longer technology or cost; it is simply deciding to measure the 90% of demand that POS never sees.

    See it on your own store footage. Book a 30-minute KenVision demo and we will walk through what footfall, conversion, and zone analytics would look like on your existing CCTV.

    Frequently asked questions

    Is camera-based footfall counting legal in Canada?

    Yes, when done with proper notice and data minimization. PIPEDA and provincial laws focus on consent, purpose, and not retaining personal information. Systems that output anonymous counts and process video on-premise — rather than storing identities — align well with these requirements. Always post notice and document your purpose.

    Do I need to replace my existing CCTV cameras?

    Usually not. If your IP cameras give a reasonable view of entrances and key zones, a camera-agnostic analytics layer can run on those feeds. You typically only add hardware to cover a specific blind spot.

    What is a good retail conversion rate to aim for?

    It varies widely by category — convenience and grocery run very high, big-ticket and specialty much lower. Rather than chase an industry number, establish your own baseline by store and daypart, then improve against it.

    How accurate is AI footfall counting?

    Modern computer-vision counting at well-placed entrances is highly accurate and validated against manual spot-counts during setup. Accuracy depends mostly on camera angle and coverage, which is why placement review is part of any serious rollout.

    How quickly can footfall analytics be deployed?

    Because it runs on existing cameras with edge processing, a single store or pilot cluster can typically be live within days, with network-wide rollout following once the metrics prove out.

  • AI Video Analytics: Turn CCTV into Real-Time Business Intelligence | KenVision

    AI video analytics is software that watches live or recorded camera feeds and turns what it sees into structured, usable data counts, alerts, patterns, and reports without a person having to stare at a screen. Instead of treating cameras as passive recorders you only review after something goes wrong, AI video analytics software makes them active sensors that understand activity as it happens. For operations leaders in 2026, that shift is the difference between footage you scrub through after the fact and real-time video analytics you act on in seconds.

    This guide explains what AI video analytics actually does, how it works, where it delivers measurable value, and what to look for when you evaluate a platform.

    From Recording to Understanding

    A traditional CCTV system answers one question: “What happened?” and only if someone goes looking. AI-powered CCTV analytics answers a more useful set: “What is happening right now, how often does it happen, and where?” The technology applies computer vision and machine learning to each frame, identifying people, vehicles, objects, and behaviours, then converting those observations into numbers and events your team can use.

    The practical payoff is that you stop paying for cameras that only help you in hindsight. The same hardware that recorded an incident can now count your customers, flag a blocked fire exit, measure how long a checkout queue has been growing, or tell you a restricted zone was entered the moment it matters.

    How AI Video Analytics Works

    Most modern video analytics software follows the same three-stage pipeline, whether it runs on a camera at the edge, on a local server, or in the cloud.

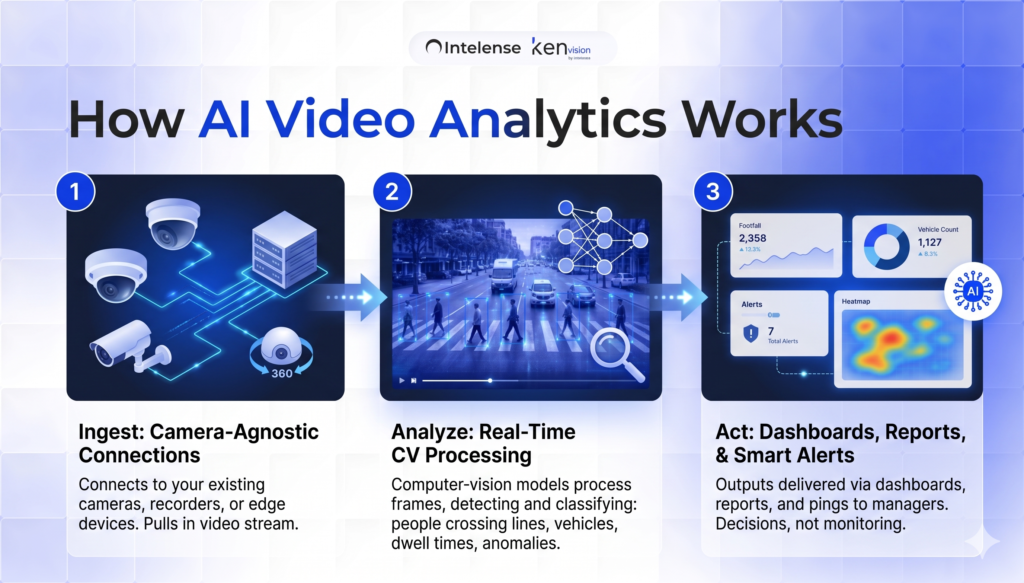
    1. Ingest
    The system connects to your existing cameras, CCTV recorders, or edge devices and pulls in the video stream. Good platforms are camera-agnostic — they work with the hardware you already own rather than forcing a rip-and-replace.

    2. Analyze
    Computer-vision models process the frames in real time, detecting and classifying what they see: a person crossing a line, a vehicle entering a lot, a dwell time exceeding a threshold, smoke developing in a corner. This is where raw pixels become events and measurements.

    3. Act
    The output is delivered as dashboards, reports, and smart alerts. A queue that crosses a threshold pings a floor manager; a weekly heatmap shows which aisles underperform; an anomaly triggers a notification. Your team spends its time on decisions, not monitoring.

    Where AI Video Analytics Delivers Value

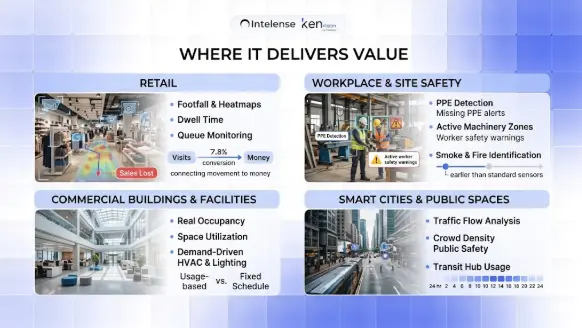
    AI video analytics is not one product — it’s a capability that shows up differently across industries. A few of the most common, high-return applications:

    Retail. Count footfall, build heatmaps of where shoppers go, measure dwell time at displays, and catch growing checkout queues before customers abandon their carts. The most valuable retail use cases connect movement to money — for example, separating visitors who browse and leave from those who convert, so you can see exactly where sales are being lost on the floor.

    Commercial buildings and facilities. Measure real occupancy and space utilization, then drive HVAC and lighting from actual usage instead of fixed schedules.

    Smart cities and public spaces. Analyze traffic flow, monitor crowd density for public safety, and understand how transit hubs and plazas are used hour by hour.

    KenVision applies this same engine across retail, commercial buildings, smart cities, and video surveillance — one platform, contextualized per environment. You can see how each plays out on the retail analytics and video surveillance pages.

    Edge, cloud, or hybrid?

    One of the first architectural decisions is where the analysis runs. Edge processing happens on or near the camera, giving the lowest latency and keeping video on-site — important for privacy and bandwidth. Cloud processing scales effortlessly across many locations. Hybrid setups combine both. The right choice depends on how many sites you run, how sensitive your footage is, and how fast you need alerts. A privacy-first, on-premise option matters more than ever for regulated industries and regions with strict data-sovereignty rules.

    What to look for in a platform

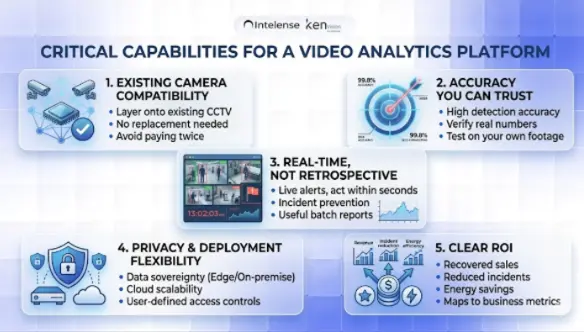
    Works with your existing cameras. If a vendor requires you to replace your CCTV, you’re paying twice. The best platforms layer onto the infrastructure you already have.

    Accuracy you can trust. Detection accuracy determines whether alerts are useful or just noise. Ask for real numbers and test on your own footage.

    Real-time, not just retrospective. The value is in acting within seconds. Batch reports are useful, but live alerts are where incidents get prevented.

    Privacy and deployment flexibility. On-premise or edge options for data sovereignty, with cloud available when you want scale.

    Clear ROI. Whether it’s recovered sales, reduced incidents, or energy savings, the platform should map to a number your leadership cares about.

    The bottom line

    AI video analytics turns cameras from a sunk cost into an intelligence layer that runs across security, operations, and customer experience at the same time. The organizations getting the most from it in 2026 aren’t buying more cameras — they’re getting far more out of the ones they already have.

    Want to see what your own footage could tell you? Book a 30-minute KenVision demo and we’ll walk through your use case.

    Frequently asked questions

    Is AI video analytics different from regular CCTV?

    Yes. CCTV records footage for later review; AI video analytics interprets the footage in real time and produces alerts, counts, and reports automatically.

    Do I need new cameras?

    Usually not. Most modern platforms, including KenVision, are camera-agnostic and work with your existing CCTV and edge devices.

    Does it work in real time?

    Yes the core advantage is acting on events as they happen, typically within seconds.

    Is my video data kept private?

    With on-premise and edge deployment options, video can be processed locally for data sovereignty.

    What industries use it most?

    Retail, workplace and construction safety, commercial real estate and facilities, manufacturing, and smart cities.